The term "liberal" continues to catch up with "conservative" as Americans' preferred description of their political views.

WASHINGTON, D.C. -- Continuing a quarter-century trend, the term "liberal" continues to catch up with "conservative" as Americans' preferred description of their political views. Thirty-five percent of U.S. adults in 2017 identified as conservative and 26% as liberal, the first time the conservative label's edge has been single digits. Its nine-percentage-point edge in 2017 is down from 11 points in 2016 and roughly 20-point advantages at times in the past.
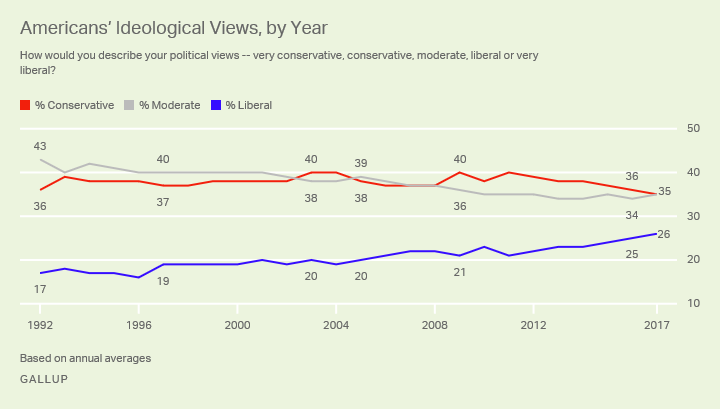
Longer term, the percentage of U.S. adults identifying as liberal has climbed from 17% the first year Gallup used this measure in 1992 to 26% in 2017, while the percentage calling themselves moderate has fallen from 43% to 35%. Conservatives' share of the political pie was about the same in 2017 (35%) as in 1992 (36%), although it rose to 40% several times in between. The residual group, generally 4% to 5% in recent years, is unable, or refuses, to classify themselves with one of the three terms.
There have been some interruptions in the rise of liberalism, most notably a period of stability (at 19%) from 1997 to 2000, and some slight reversals at the start of Barack Obama's presidency. But the long-term pattern is one of a growing proportion of liberals, offset mainly by fewer moderates.
These findings are based on annual averages of Gallup's multiday, nontracking surveys. The 2017 aggregate includes 13 different surveys conducted between January and December, totaling 12,766 national adults.
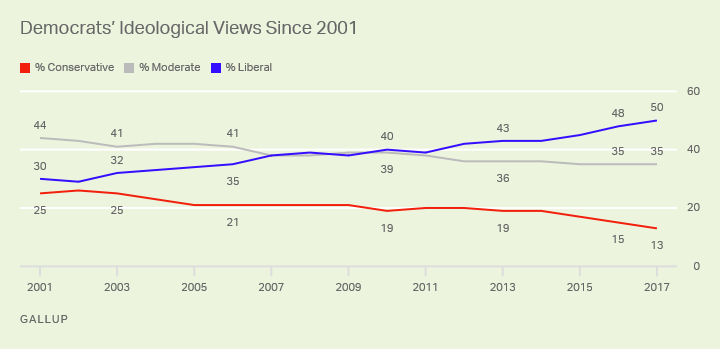
Leftward Shift Mainly Attributable to Democrats
Almost all of the shift since 2001 toward the liberal label is the result of Democrats increasingly adopting the term. As a result, the Democratic Party has moved from a fairly mixed party ideologically at the start of the century to one that is now decidedly left-leaning.
In 2001, nearly as many Democrats identified as conservative (25%) as liberal (30%), while the largest segment, 44%, were moderate. Since then, the percentage of Democrats identifying as liberal has risen by about a point a year, reaching 50% this year for the first time.
Meanwhile, fewer and fewer Democrats have identified as moderate or conservative.
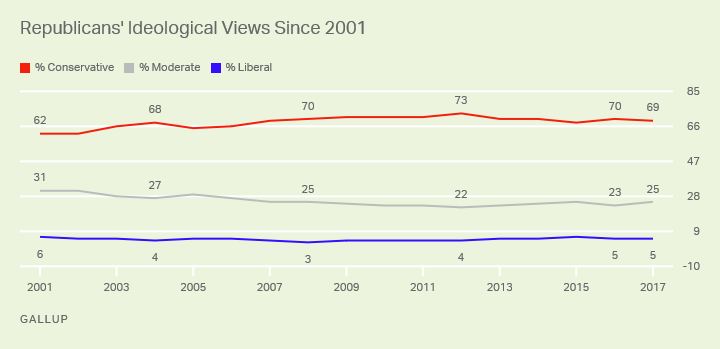
GOP Remains a Mainly Conservative Party
The Republican Party has undergone far less ideological change over the past 17 years, with the vast majority of its supporters consistently seeing themselves as conservative and most of the rest identifying as moderate. No more than 6% have called themselves liberal across the entire 2001 to 2017 period.
The only change in Republicans' ideology has been at the margins, including a seven-point increase since 2001 in the percentage identifying as conservative. There has been a corresponding decline since 2001 in the percentage identifying as moderate -- now 25%, down from 31%.
Independents' ideological views have varied over the past 17 years, but after a slight increase in conservatism from 2009 to 2013, their ideological profile has returned to what it was in 2001.
The largest segment of independents -- 43% in 2017 -- has consistently been moderate, while slightly more have identified as conservative than liberal.

Stark Ideological Differences Seen by Gender, Age, Education and Region
As shown in the accompanying table of 2017 results, Gallup also sees differences in Americans' ideological views among demographic groups. The greatest of these are by age and education, as older and less-educated adults tend to be conservative, while younger and more highly educated adults tend to be liberal.
There is also a sizable spread by gender, although neither group tilted liberal in 2017. Men showed a 16-point preference for the conservative label, while women were closely split between conservative and liberal.
| Conservative | Moderate | Liberal | % Conservative minus % Liberal | |||||||||||||||||||||||||||||||||||||||||||||||||||||||||||||||||||||||||||||||||||||||||||||||||
|---|---|---|---|---|---|---|---|---|---|---|---|---|---|---|---|---|---|---|---|---|---|---|---|---|---|---|---|---|---|---|---|---|---|---|---|---|---|---|---|---|---|---|---|---|---|---|---|---|---|---|---|---|---|---|---|---|---|---|---|---|---|---|---|---|---|---|---|---|---|---|---|---|---|---|---|---|---|---|---|---|---|---|---|---|---|---|---|---|---|---|---|---|---|---|---|---|---|---|---|---|
| % | % | % | pct. pts. | |||||||||||||||||||||||||||||||||||||||||||||||||||||||||||||||||||||||||||||||||||||||||||||||||
| Gender | ||||||||||||||||||||||||||||||||||||||||||||||||||||||||||||||||||||||||||||||||||||||||||||||||||||
| Men | 38 | 36 | 22 | +16 | ||||||||||||||||||||||||||||||||||||||||||||||||||||||||||||||||||||||||||||||||||||||||||||||||
| Women | 31 | 34 | 30 | +1 | ||||||||||||||||||||||||||||||||||||||||||||||||||||||||||||||||||||||||||||||||||||||||||||||||
| Age | ||||||||||||||||||||||||||||||||||||||||||||||||||||||||||||||||||||||||||||||||||||||||||||||||||||
| 18 to 29 | 23 | 40 | 32 | -9 | ||||||||||||||||||||||||||||||||||||||||||||||||||||||||||||||||||||||||||||||||||||||||||||||||
| 30 to 49 | 32 | 36 | 29 | +3 | ||||||||||||||||||||||||||||||||||||||||||||||||||||||||||||||||||||||||||||||||||||||||||||||||
| 50 to 64 | 40 | 35 | 21 | +19 | ||||||||||||||||||||||||||||||||||||||||||||||||||||||||||||||||||||||||||||||||||||||||||||||||
| 65+ | 45 | 29 | 23 | +22 | ||||||||||||||||||||||||||||||||||||||||||||||||||||||||||||||||||||||||||||||||||||||||||||||||
| Education | ||||||||||||||||||||||||||||||||||||||||||||||||||||||||||||||||||||||||||||||||||||||||||||||||||||
| High school or less | 39 | 34 | 22 | +17 | ||||||||||||||||||||||||||||||||||||||||||||||||||||||||||||||||||||||||||||||||||||||||||||||||
| Some college | 36 | 36 | 24 | +12 | ||||||||||||||||||||||||||||||||||||||||||||||||||||||||||||||||||||||||||||||||||||||||||||||||
| College graduate | 32 | 36 | 30 | +2 | ||||||||||||||||||||||||||||||||||||||||||||||||||||||||||||||||||||||||||||||||||||||||||||||||
| Postgraduate | 25 | 35 | 38 | -13 | ||||||||||||||||||||||||||||||||||||||||||||||||||||||||||||||||||||||||||||||||||||||||||||||||
| Region | ||||||||||||||||||||||||||||||||||||||||||||||||||||||||||||||||||||||||||||||||||||||||||||||||||||
| East | 29 | 35 | 32 | -3 | ||||||||||||||||||||||||||||||||||||||||||||||||||||||||||||||||||||||||||||||||||||||||||||||||
| Midwest | 36 | 36 | 24 | +12 | ||||||||||||||||||||||||||||||||||||||||||||||||||||||||||||||||||||||||||||||||||||||||||||||||
| South | 40 | 35 | 20 | +20 | ||||||||||||||||||||||||||||||||||||||||||||||||||||||||||||||||||||||||||||||||||||||||||||||||
| West | 32 | 34 | 30 | +2 | ||||||||||||||||||||||||||||||||||||||||||||||||||||||||||||||||||||||||||||||||||||||||||||||||
| Party ID | ||||||||||||||||||||||||||||||||||||||||||||||||||||||||||||||||||||||||||||||||||||||||||||||||||||
| Republicans | 69 | 25 | 5 | +64 | ||||||||||||||||||||||||||||||||||||||||||||||||||||||||||||||||||||||||||||||||||||||||||||||||
| Independents | 29 | 43 | 24 | +5 | ||||||||||||||||||||||||||||||||||||||||||||||||||||||||||||||||||||||||||||||||||||||||||||||||
| Democrats | 13 | 35 | 50 | -37 | ||||||||||||||||||||||||||||||||||||||||||||||||||||||||||||||||||||||||||||||||||||||||||||||||
| 2017 averages | ||||||||||||||||||||||||||||||||||||||||||||||||||||||||||||||||||||||||||||||||||||||||||||||||||||
| GALLUP | ||||||||||||||||||||||||||||||||||||||||||||||||||||||||||||||||||||||||||||||||||||||||||||||||||||
Ideology also differs significantly by U.S. region, generally conforming with traditional red-/blue-state voting patterns. Residents of the East are more likely to be liberal than conservative by a three-point margin, whereas residents of the Midwest and South lean conservative by double-digit margins. Residents of the West are closely split.
Bottom Line
For many years, liberals were a small minority in the U.S., but their numbers have gradually increased to within single digits of conservatives. However, rather than being a broad societal trend, this mainly reflects a shift among Democrats, who are now on the cusp of being a majority-liberal party. Meanwhile, Republicans have become an even more conservative party, underscoring the increased polarization of the country occurring on a broad swath of issues. Independents remain more evenly split, albeit a bit more moderate than the country as a whole.
The increased use of "liberal" to define one's politics may partly be a matter of semantics if, for instance, the term is simply becoming more acceptable, particularly among Democrats. But it also coincides with expanded Democratic support for immigration and stricter gun laws, greater worry about global warming, and diminished support for the death penalty -- all issues on which Republicans' views haven't changed or have grown more conservative. At the same, both groups have grown more accepting of gay marriage and legalizing marijuana, but on balance, liberals have moved to the left on far more issues than Republicans. In other words, Democrats' closer attachment to the liberal label may simply reflect the reality that their views are more liberal.
http://news.gallup.com/poll/225074/conservative-lead-ideology-down-single-digits.aspx
Tags
Who is online

88 visitors
This is a fascinating article for a number of reasons , not the least of which is because it points out something rarely mentioned - namely that Republicans have been and are a lot more 'ideological' than Democrats are. Yes, about 10 % more Americans identify as conservative than liberal, BUT, this is entirely explained by the fact that a higher percentage of Republicans identify with the ideology associated with their party than Democrats do.
It is not that the country is more conservative, it is that the 'conservative' political party has more ideologues.
Another interesting aspect of the article is that younger and more educated people are trending toward liberal beliefs.
50 percent of Democrats identify as liberal, but 69 percent of Republicans identify as conservative. Our current president appears to be turning Democrats out of the 'closet' and into a more liberal stance. The November results this year will be the proof in the pudding.
As crusty old conservatives die off, they get replaced with younger people who are more capable of change and critical thinking. I see this trend continuing indefinitely.
you see in the polling the evidence of this
the red number after the age designation is the conservative percent, the grey is moderates, and the blue is liberals.
Age has everything to do with it.
Yes, with age comes wisdom. Go figure.
"People worry about what kind of planet we're leaving for our kids....
But...
People might want to spend more time considering what kind of kids we're leaving for our planet" !
Obviously why conservatives control every aspect of American government.
Also Obvious, a nation manipulated by old WHite men, playing on old WHite peoples fears.
REpublican Party will die off faster now.
We gave a young black man a chance, he fucked it up. I don't think you'll see another black U.S. President in your lifetime, just sayin...
Delusional.
how wrong you would be ?
Obama fucked up, what exactly ?
Delusional and overtly racist.
He fucked up just about everything.
Ok, I'll just pull something out of thin air..
61.5% of Americans Disapprove of How Obama Handled ISIS
Do you approve or disapprove of the way Barack Obama is handling ISIS, the Islamic militant group that controls some areas of Iraq and Syria?
Approve: 34.5%
Disapprove: 61.5%
No Opinion: 4.5%
That's just one thing, there are hundreds, thousands of things he fucked up, way to many to list here. IMO he scared people off electing another black person any time soon.
Skirting the CoC [ph]
According to CCM, the "fact" that one black person "fucked up" should or will "scare people off" from supporting an entirely different black man or woman for far into the future.
Racism? What else could it be?
Sometimes people don't think before they open the yap.
and sometimes they do eg Trumps shithole comment
though many of his gaffs, were just that
Interesting thought, what else could it be? Stereotyping maybe? I don't know what goes through the minds of all people, and I for one would vote for a conservative black man, like Herman Cain, but I'm not the rest of America.
History will remember Obama as the best President ever.
History will remember Trump as the worst president ever.
OMG ..... you can not be serious. The best ever?
Not even close. He'll be lucky to be in the top ten
Who knows what the future holds, but as of right now, Trump has been one of the greatest Republican presidents ever, not saying that that couldn't change tomorrow, but we'll just have to wait and see.
As far as Obama, he was the first Mulato president, that is the only historic thing he's done, other than raise the deficit to record levels I suppose.
I honestly don't understand how anyone could call BO, one of the biggest failures of all times, the best president ever. Do you people even own a history book?
Commence facepalm. And what history book might you be referring to? Something by Ann Coulter maybe?
Skirting the CoC [ph]
Bugsy, you have a 2 day suspension ending Jan 17 at 3:30 pm est.