The one tax graph you really need to know

At the heart of the debate over "the 47 percent" is an awful abuse of tax data.
This entire conversation is the result of a (largely successful) effort to redefine the debate over taxes from "how much in taxes do you pay" to "how much in federal income taxes do you pay?" This is good framing if you want to cut taxes on the rich. It's bad framing if you want to have even a basic understanding of who pays how much in taxes.
There's a reason some would prefer that more limited conversation. For most Americans, payroll and state and local taxes make up the majority of their tax bill. The federal income tax, by contrast, is our most progressive tax -- it's the tax we've designed to place the heaviest burden on the rich while bypassing the poor. And we've done that, again, because the working class is already paying a fairly high tax bill through payroll and state and local taxes.
But most people don't know very much about the tax code. And the federal income tax is still our most famous tax. So when they hear that half of Americans aren't paying federal income taxes, they're outraged -- even if they're among the folks who have a net negative tax burden! After all, they know they're paying taxes, and there's no reason for normal human beings to assume that the taxes getting taken out of their paycheck every week and some of the taxes they pay at the end of the year aren't classified as "federal income taxes."
Confining the discussion to the federal income tax plays another role, too: It makes the tax code look much more progressive than it actually is.
Take someone who makes $4 million dollars a year and someone who makes $40,000 a year. The person making $4 million dollars, assuming he's not doing some Romney-esque planning, is paying a 35 percent tax on most of that money. The person making $40,000 is probably paying no income tax at all. So that makes the system look really unfair to the rich guy.
That's the basic analysis of the 47 percent line. And it's a basic analysis that serves a purpose: It makes further tax cuts for the rich sound more reasonable.
But what if we did the same thing for the payroll tax? Remember, the payroll tax only applies to first $110,100 or so, our rich friends is only paying payroll taxes on 2.7 percent of his income. The guy making $40,000? He's paying payroll taxes on every dollar of his income. Now who's not getting a fair shake?
Which is why, if you want to understand who's paying what in taxes, you don't want to just look at federal income taxes, or federal payroll taxes, or state sales taxes -- you want to look at total taxes. And, luckily, the tax analysis group Citizens for Tax Justice keeps those numbers. So here is total taxes -- which includes corporate taxes, income taxes, payroll taxes, state sales taxes, and more -- paid by different income groups and broken into federal and state and local burdens:
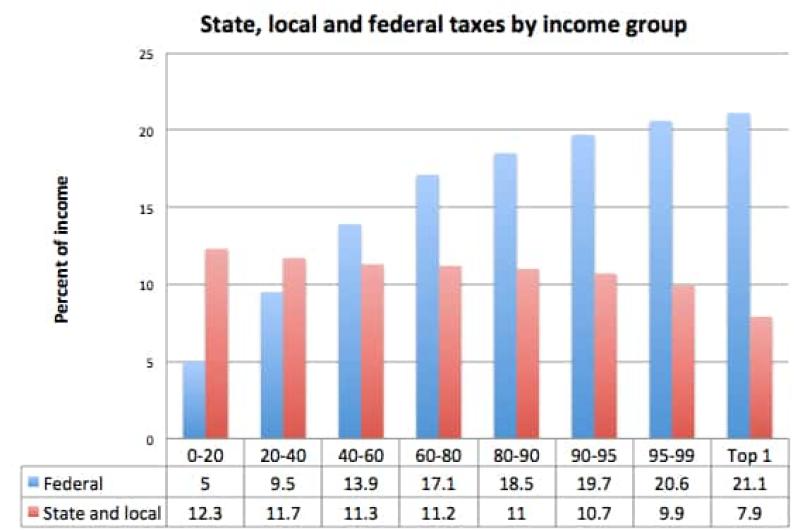
As you can see, the poorer you are, the more state and local taxes bite into your income. As you get richer, those taxes recede, and you're mainly getting hit be federal taxes. So that's another lesson: When you omit state and local taxes from your analysis, you're omitting the taxes that hit lower-income taxpayers hardest.
But here is really the only tax graph you need: It's total tax burden by income group. And as you'll see, every income group is paying something, and the rich aren't paying much more, as a percentage of their incomes, then the middle class.
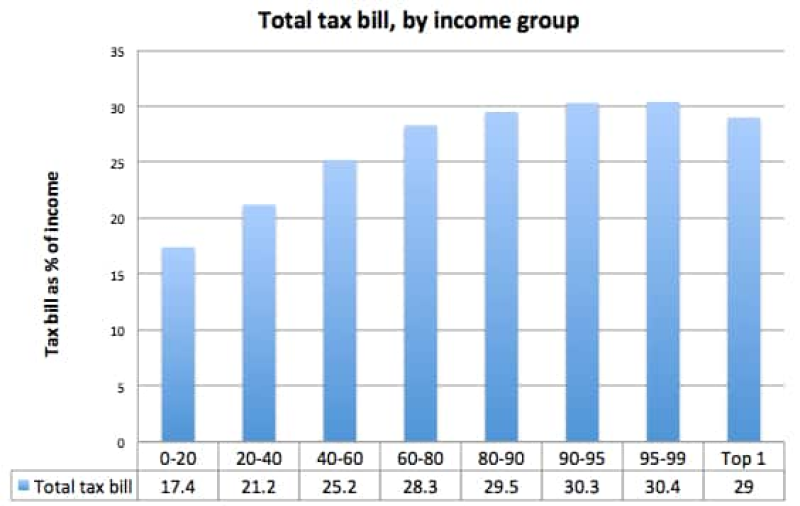
That's really what the American tax system looks like: Not 47 percent paying nothing, but everybody paying something, and most Americans paying between 25 percent and 30 percent of their income -- which is, by the way, a lot more the 13.9 percent Mitt Romney paid in 2011*.
When politicians try to convince you that half of Americans aren't really paying taxes, it's usually because the real data undermines their preferred policies. For instance, you wouldn't look at these numbers and think tax cuts for the rich need to be a huge priority. And that's one reason people who want more tax cuts for the rich don't like to show you these numbers.
* Romney's 13.9 percent rate only counts his federal taxes. He hasn't released his state and local returns for 2011, so we can't say how that would change his total tax rate. But given the state and local averages for someone in his income group, it's likely to remain well below the 25-30 percent that is typical.
Original article by Ezra Klein , in Wonkblog .
Tags
Who is online
72 visitors
This article is a few years old - Ezra Klein was still at Wonkblog!
Mitt Romney was recorded denigrating "the 47% who pay no income taxes". He was implying that almost half the population was not pulling its share of the burden. So wonks like Ezra Klein brought out the facts. (This was before the Tea Party crazies put an end to reality in Republican politics by putting a reality-TV personality in the White House.)
The situation is worse today, of course, after the Republicans passed their tax-cut-for-the-rich "reform".
The point then, even more true today, is that it is profoundly misleading - to the point that it is Bad Faith - to speak of income taxes as though they are representative of the tax burden.
Skirting the CoC [ph]
- the single largest revenue source of budget comes from individual Fed Income Tax at about 45% of the total budget
- nearly 50% of all Americans pay nothing towards that 45%
- about 40% of that Fed budget revenue comes from Payroll taxes and the lions share of that is paid by the top 50% of income earners since they make the most money. So again, lower income earners aren’t carrying the load there either
While those in lower tax brackets do pay Payroll Taxes, the progressive nature of our tax system does insure that upper income earners carry the largest % of the total Fed Budget revenue load. It’s puzzling why you appear to be trying to convince everyone here that isn’t true by pushing the Payroll Tax only angle.
Alternatively:
1) You didn't read the seed.
2) You did read the seed, but somehow did not notice that it is about "total tax burden", and therefore you continue to blindly limit your posts to federal taxes.
3) You understand, but are posting in Bad Faith .
Actually:
1a) I did read the seed
2a) I did notice and clearly posted who carries the heaviest burden (by far actually) of the total Federal Revenue collected for the Federal Budget. And it is not lower incomers. It’s not even close but that stands to reason since they make the least and our tax system is largely progressive by design.
3a) LoL, you are what you say you abhor then I guess. The disingenuous nature of your argument is appalling actually. But by all means Bob, spin the numbers to your own effect all you want. I know you will. All future sophomoric insults you may toss aside, you aren’t fooling anyone. Well, perhaps some liberal drones here but that’s about it
This article is "In Bad Faith". If it was in Good Faith, it would actually break down the tax burden by state and specific locales. Where I live in Oregon, we do not pay any local income taxes; but we pay State and Federal Income Taxes. We, also, don't pay a Sales Tax. However, we do have various fees and taxes on our Utility bills (Water/Sewer, Electricity, Internet, etc.) and services. I could not find any information on property taxes, and as I rent, I do not pay those directly. Pennsylvania, on the other hand, has fees and taxes on Utilities and services, but also has income, sales, and property taxes. And, those property tax rates can vary even within a single School District. So, in reality, the entire tax burden picture is far more complex than even what this article is arguing. It is taking an average of income rates and an average of estimated tax burdens to come up with an answer that fits his attempt to cast aspersions on a claim that is accurate based on only direct Federal income taxes (1040, 1040A, 1040EZ).
Apparently you don't understand the notion of Good Faith / Bad Faith . I invite you to follow the link.
Good faith is always being honest in your assessment, and my point is that the author of the article was not being honest.
Prove it.
You didn't bother reading my original comment did you?
If you don't supply a link... not a chance.
Here is the property tax chart for Centre County PA. Look at the property taxes for Bellefonte Boro and Spring Township. They are both part of the Bellefonte Area School District, while the actual school district property tax rate is the same, they have different property tax rates overall:
Is this link supposed to somehow prove that "the author of the article was not being honest"?
Wow, you really want to do zero thinking on your own, don't you? The link is to the property tax rates of Centre County, which is part of the LOCAL tax burden people have and which shows that the rates that people pay vary and points to the author simplifying taxes to prove a point that in turn was arguing that someone else was ignoring the "true tax burden". That makes both the author and the person he was replying to both dishonest as they both simplified everything for their points. The first person (Mitt Romney) was talking about Federal Income Tax burdens and who paid them. The author expanded the playing field just a little bit by including "true tax burden"; but forgot that the REAL true tax burden varies from locale to locale and depends in part whether the person paying the taxes actually pays property taxes and that could vary regardless of property ownership rates. The fact you don't see it, shows that you don't want to know the actual truth and are acting "In Bad Faith".
Locking for the night.
Unlocked for a while, before this morning's round of golf...
Locked for golf
wadya shoot?
I’m jealous, at least three four more weeks till golf here
Get off your scaly fish butt and get a rousing game of hangfish going!