In a word, yes.
The physics of the greenhouse theory (the Climate 1, What determines our climate? page) suggests that temperatures will increase, roughly in line with atmospheric carbon dioxide levels. The graph below shows carbon dioxide levels and temperatures recorded over the last century or so. The carbon dioxide levels up to around the 1970's have been obtained from the air trapped in ice cores in the Antarctic. Since the 1960's the levels have been measured directly by observatories in Hawaii and Tasmania. There are two sets of global mean temperature measurements shown - one from NASA in the USA and the other from the UK Met office. Other groups around the world also produce data like this, but they all look fairly similar. (One exception is the graphs produced from measurements made only by satellites rather than actual ground readings. The overall pattern is similar, but there are differences over short terms. There is more on this in the Climate Physics section .)
The graph below shows the temperature change up to the end of 2016 as measured by both NASA and the UK Met. Clearly 2016 was by far the hottest year so far. In fact each of 2014, 2015 and 2016 have been record years! (2005 and 2010 were also record years.) The "Temperature anomaly" is the difference in temperature from the 1880 - 1920 mean (which was already a little over the so-called "pre-industrial" temperature). In other words, we are already over half way to the so called dangerous 2 degree rise which all governments have pledged to stay below - much less the 1.5 degree rise many scientists believe dangerous - and has been agreed to in the Paris talks (at least as an 'aspiration'). Also note that most of this rise has occurred in just the last few decades. Unfortunately, at the current rate of increase you can easily see that without urgent action we are likely to reach the 2 degree rise around mid-century. Indeed, many scientists say that it may already be too late to avoid a 2 degree rise, much less a 1.5 degree rise because of the lag between CO2 and temperature rise.
The graph below shows the temperature change up to the end of 2016 as measured by both NASA and the UK Met. Clearly 2016 was by far the hottest year so far. In fact each of 2014, 2015 and 2016 have been record years! (2005 and 2010 were also record years.) The "Temperature anomaly" is the difference in temperature from the 1880 - 1920 mean (which was already a little over the so-called "pre-industrial" temperature). In other words, we are already over half way to the so called dangerous 2 degree rise which all governments have pledged to stay below - much less the 1.5 degree rise many scientists believe dangerous - and has been agreed to in the Paris talks (at least as an 'aspiration'). Also note that most of this rise has occurred in just the last few decades. Unfortunately, at the current rate of increase you can easily see that without urgent action we are likely to reach the 2 degree rise around mid-century. Indeed, many scientists say that it may already be too late to avoid a 2 degree rise, much less a 1.5 degree rise because of the lag between CO2 and temperature rise.
The total climate of the Earth involves all of the land, the oceans and the atmosphere. To answer the question at the top of this page we really need to consider all of these. However, in much of the common discussion, the surface atmospheric temperature is taken as an indication of the state of the climate. The problem with this approach is that the atmosphere only contains a very small amount of the total heat in the whole system. It's average temperature also varies considerably with a number of climate cycles (the El Niño - La Niña, or ENSO oscillation for example). However, atmospheric temperature is relatively easy to measure and is a reasonable indicator of the state of the climate provided we remember that it is subject to a lot of variations.
It's pretty hard to deny that the temperature is increasing!
It is very clear from this graph that the temperature is going up roughly in line with the carbon dioxide levels. There is a lot of variation from year to year, in fact from decade to decade, but the trend is very obvious. As we saw previously, there are a number of factors apart from CO2 that affect the climate: volcanoes, solar variations, ocean circulation patterns and more. Much of the variation in atmospheric temperatures can be understood in terms of these factors. For example, 1998 stands out as an exceptionally hot year, about 0.2 degrees warmer than the years around it. The reason is well understood - an exceptional El Niño. The current (2015-16) El Niño has also been another strong one, although not as strong as 1998. However, it is interesting to note that what, in 1998, was an exceptionally high temperature is now a relatively 'low' temperature!
So has there been a pause?
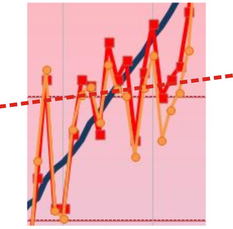
There has been a lot of talk about a 'pause' or 'hiatus' in temperatures recently. If one takes only the last 20 or so years from the graph above (and ignore 2015 and 2016!) one can see that perhaps there has been a slowing down in the rate of increase - the red dotted line on this clip from the last twenty years on the graph above. However, if we were to transfer that dotted line to the main graph it would surely look very out of place - particularly when we take 2015/16 into account! There have been many other periods in which there have been flat sections, or even a drop, but the long term trend is very clear. The last decade or two have also seen a rather unusually quiet Sun, which could well account for some of the apparent slow down. Let's hope the Sun stays quiet! (But don't count on it.)
Another thing to remember is that 1998 was an exceptionally hot year due to the El Niño and there hadn't been another one like it - until 2015-16. That El Niño year was over 0.2 degrees hotter than the 1998 peak. If we were to ignore the 1998 spike there would be no sign of a pause at all. And of course when we take into account the current 2016 temperature rise the pause all but disappears. With the latest rises any talk of a 'pause' is clearly nonsense.
Yet another factor in recent temperatures has been the 'Interdecadal Pacific Oscillation'. This is a longish term variation (years to decades) which transfers heat between the east and west sides of the Pacific ocean - with consequences for the amount of heat going into the atmosphere. Recently it has been in a 'negative' phase, meaning it has absorbed heat from the atmosphere. When it changes to the opposite phase much of that heat will be returned to the atmosphere.
It is important to remember that climate models actually predict a large amount of variability (see the 'Let's look at the predictions' section on the Climate 1 page.) Some people simply look at the average predictions of the models (which of course are much smoother) and suggest that they predict a smooth increase, when in fact they don't. The considerable variations we see in the actual temperature graphs are quite consistent with the variations predicted by individual model runs. And don't forget that while the variability predicted by models has 'flat spots' those flat spots are often followed by sharp rises!
Most of the heat goes to the oceans
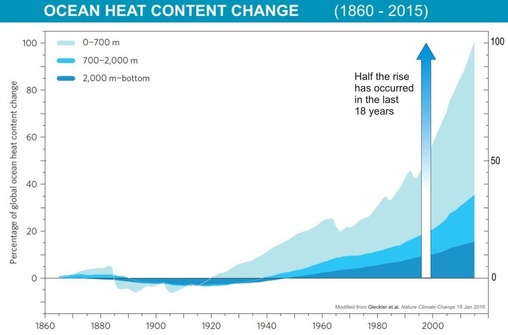
Only about 2% of the heat goes into the atmosphere. A bit more goes into the land, but around 93% of the added greenhouse heat goes into the oceans. So that's where we really need to look to see if the world is heating up. Unfortunately measuring the total heat content of the oceans is no easy job! It requires millions of measurements at all depths all around the world. Nevertheless, with the help of automatic buoys which sink and then float, continually measuring temperatures, we have reasonably good estimates of the total heat content of the oceans, or more particularly the changes in the heat content, over the last few decades. The graph at left from Industrial-era global ocean heat uptake doubles in recent decades by Peter J. Gleckler in Nature Climate Change shows ever rising heat in the oceans - and certainly no sign of a pause. In fact if there has been a pause (in the atmospheric temperatures) it is probably because more of the heat has been going into the oceans - as can be seen by the steep upturn in recent times, with over half the warming taking place in the last couple of decades.
The problem is that those various ocean cycles we mentioned involve heat going in and out of various parts of the ocean. So when the cycles cycle we may see a lot more heat returning to the atmosphere. And of course it is the ocean heat moving into the atmosphere that drives storms, cyclones and hurricanes. The more heat, the more intense the cyclone. Interestingly, it is thought that we won't get more storms and cyclones, just more powerful ones.
The problem is that those various ocean cycles we mentioned involve heat going in and out of various parts of the ocean. So when the cycles cycle we may see a lot more heat returning to the atmosphere. And of course it is the ocean heat moving into the atmosphere that drives storms, cyclones and hurricanes. The more heat, the more intense the cyclone. Interestingly, it is thought that we won't get more storms and cyclones, just more powerful ones.
And that brings us to sea level rise (or SLR)
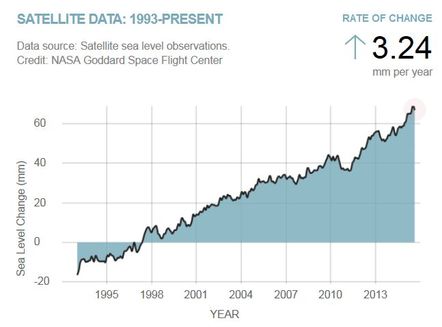
Most people think of SLR as the result of melting ice. Yes, certainly. But most of the SLR we have seen so far is not so much melting ice but simply the expansion of the oceans due to heating. Mind you, the rate of SLR due to melting ice is rapidly increasing and will soon become more significant than the expansion effect - that's when we will see SLR take off, so to speak. This graph, from NASA shows SLR over the last couple of decades. At present it is going up at about 3.24 mm per year, which would result in 32 cm by the end of the century. The problem is that the rate is increasing and we know that is due to the accelerating rate at which ice is melting. While the IPCC estimates are a bit under a metre by the end of century, many scientists suggest that because of factors we don't fully understand in the way glaciers and polar ice sheets melt it could be much more than that. It is a question of risk. Maybe there's only a 10% chance of more than a metre rise - but that would be disastrous for large parts of the world. Do we really want to take that risk? Would you get on an aeroplane if there was even a 1% chance of it crashing?!
Climate change IS natural - it's been all over the place in the past
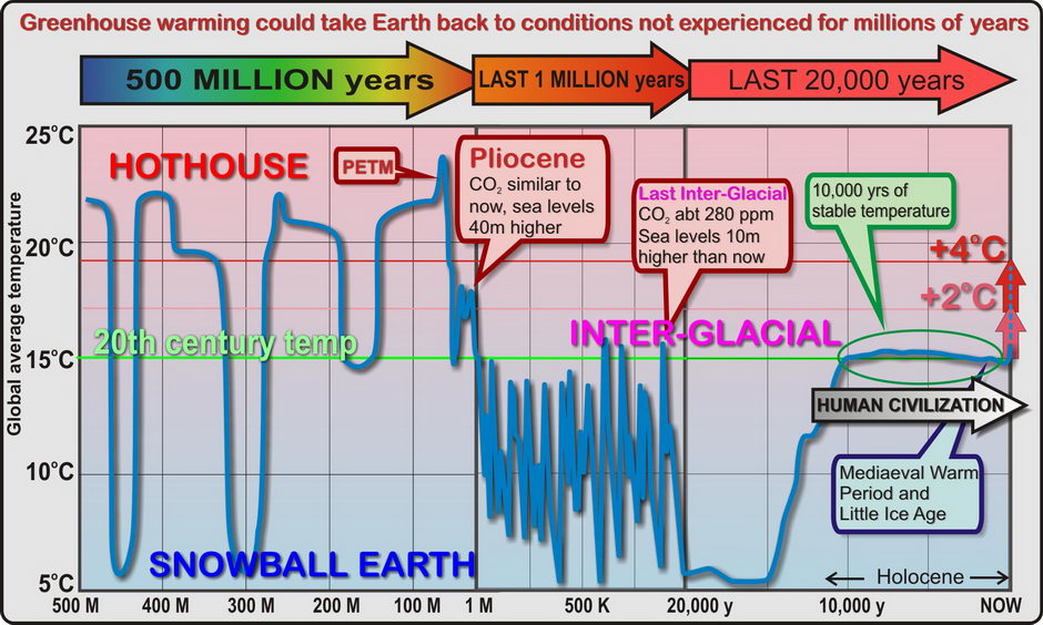
It is true that climate change is natural. It has happened a lot over geological time. But just not in the time of human civilisation. Yes there has been the MWP (Medieval Warm Period) and the LIA (Little Ice Age) but they were just very small blips on the overall scene (you can see them near the edge of the graph below). The graph looks complicated, but tells a very important story. Let's take a look at the various sections. You will notice that there are three main sections, the 500 million years ago section, then the last 1 million years ago has been expanded and the final 20 thousand years expanded again. We have to break it up like that because of the huge times involved. In fact, if we showed the whole period at the scale of the last 20 thousand years section, the graph would be about 2 kilometres long! Even just the last 1 million years would go for 4 metres.
Now of course it is the last 20 thousand years that is most important to us. About 15 thousand years ago Earth started coming out of a serious ice age. So much water was locked up as ice on land that sea levels were about 100 metres lower than today. But by around 10 thousand years ago the climate steadied and we have had pretty constant conditions since. And that's the period over what we call civilisation has developed. In fact, since about 10,000 years ago the temperature did gradually drop by around one degree. However, as we well know, we have regained that one degree in just the last century or so (the sudden upturn in the blue line right at the end). If it were not for that upturn Earth would have headed back to an ice age in a few thousand years - so its just as well we started putting CO2 into the atmosphere! (But perhaps we have overdone it?)
Now, as you can see, over the last one million years Earth has been going in and out of ice ages. More particularly that whole period is referred to as an ice age, but the high points are referred to as 'interglacials'. That's because there is still a lot of ice around. But before one million years ago Earth spent most of its time in 'hot ages', with the occasional dip into an ice age. In the hot ages there was little ice around - all the water was in the sea - and so sea levels were up to 100 metres higher. We understand the reasons for quite a few of these dramatic changes, but there are still a lot of mysteries. We will come back to the Pliocene age and the PETM because they are of rather special interest as CO2 levels were similar to what they are now - but sea levels a lot higher. But first lets look at the last one million years of up and down temperatures. [Note: this graph doesn't pretend to be very precise, but it does give the overall picture within it's limitations.]
Now, as you can see, over the last one million years Earth has been going in and out of ice ages. More particularly that whole period is referred to as an ice age, but the high points are referred to as 'interglacials'. That's because there is still a lot of ice around. But before one million years ago Earth spent most of its time in 'hot ages', with the occasional dip into an ice age. In the hot ages there was little ice around - all the water was in the sea - and so sea levels were up to 100 metres higher. We understand the reasons for quite a few of these dramatic changes, but there are still a lot of mysteries. We will come back to the Pliocene age and the PETM because they are of rather special interest as CO2 levels were similar to what they are now - but sea levels a lot higher. But first lets look at the last one million years of up and down temperatures. [Note: this graph doesn't pretend to be very precise, but it does give the overall picture within it's limitations.]
It's Milankovitch again!
You may remember from the beginning of our story about what determines our climate that we mentioned we would come back to those Milankovitch cycles. It is those 'wobbles' in the Earth's orbit that are responsible for all those ups and downs in the last one million years (and many before that as well!) It turns out that there is a nice correlation between those ups and downs and Milankovitch's cycles. The small changes in distance to the Sun, and angles to the Sun resulted in very small changes in the amount of heat the Earth has received. The curious thing, however, is that these very small changes in the amount of heat received by the Earth resulted in large changes in the climate - from full on 'ice ages' to the more pleasant 'inter-glacials' - as we have now.

This graph illustrates the last few hundred thousand years during which the Earth has been going in and out of four full ice ages. It has not been coming completely 'out' of ice ages, rather to a semi-stable state known as an 'interglacial'. We are, of course, now in an interglacial and have been for about 10,000 years. Now the really interesting thing is that there has clearly been a close relationship between the amount of CO2 in the air and the temperature (the temperature shown here is that in Antarctic ice cores - but is indicative of changes in the global temperatures).
Now we know that it was the Milankovitch cycles that triggered the changes (when the various cycles are put together they show warming at the start of the interglacials). But the question is, how did such small changes in solar energy result in such large changes in the Earth's temperature?
A clue to the answer to this question is that when this sort of graph is examined carefully, we find that the CO2 levels start to rise a little after the warmer periods start. Scientists understand that this is another of those 'positive feedback' effects. As you will know from experiments with fizzy drinks, gases don't dissolve as well in warm water as in cold. (They go flat faster when not in the fridge!)
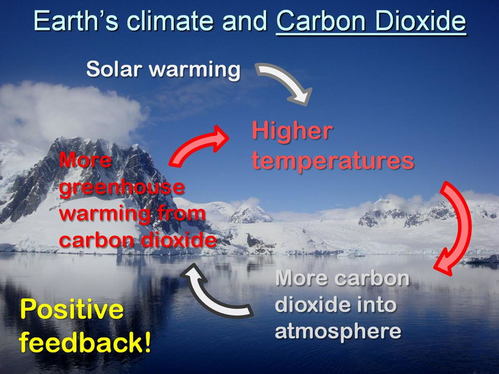
So as the oceans warm a little, the dissolved CO2 starts to come out of the ocean into the atmosphere - raising the concentration as the blue lines in the graph above show. Now this extra CO2 in the atmosphere is a strong greenhouse gas and so the atmosphere warms further - releasing yet more CO2 from the ocean. More water vapour is evaporated as well, adding further to the effect. And so it goes on. Well fortunately not forever! (Note: It DID go on forever on Venus and that's why its average temperature is something like 450 degrees! But Venus is closer to the Sun and that's why things got out of control.)
Fortunately, as water vapour builds up in the atmosphere, clouds are more able to form and they reflect sunlight and that provides a negative feedback which eventually slows the warming. As well, by the time the warming becomes significant the Milankovitch cycles tend to reverse and so cool things again. (In fact that's why the Earth would be cooling toward another ice age now if it weren't for the extra CO2 we have put in the atmosphere.)
Fortunately, as water vapour builds up in the atmosphere, clouds are more able to form and they reflect sunlight and that provides a negative feedback which eventually slows the warming. As well, by the time the warming becomes significant the Milankovitch cycles tend to reverse and so cool things again. (In fact that's why the Earth would be cooling toward another ice age now if it weren't for the extra CO2 we have put in the atmosphere.)
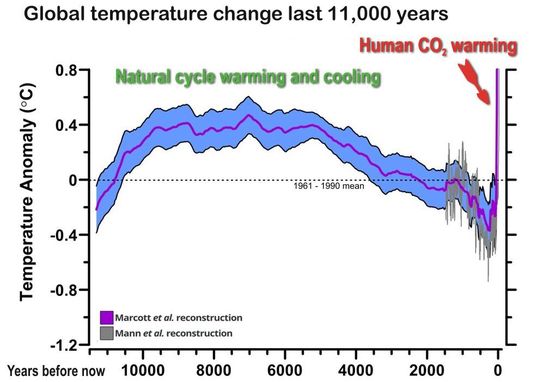
Now, looking back at the 'Temperatures and Carbon dioxide in Antarctica' graph above, you will see that in just the last century or so the CO2 levels have gone way above what they have been over the last 350,000 years (in fact above what they have been for several million years). This is of course due to our fossil fuel burning. So clearly, the important question is, will the red line follow the blue line upwards? In other words, will the temperature continue to rise in line with the CO2 levels?
Well, looking at the graph right at the top of this page (Temperature and Carbon dioxide 1880 - 2015) it is clear that there is good reason to believe the answer is yes. There is, however, a difference between what happened over the last few hundred thousand years and what is happening today. It is the rate at which things are changing . This is clear on this graph of temperatures over the last 11,000 years. It took thousands of years for the Earth to come out of the last ice age, and thousands of years for the temperature to drop a bit over half a degree. But it has only taken around one hundred years for us to increase the CO2 from 300 ppm to 400 ppm and for the temperature to shoot up now by over one degree!
The Earth is huge and takes a long time to warm up or cool down, so even with the rapid increase in the greenhouse effect it can't respond very quickly. It will take many decades for the temperature of the Earth to 'catch up' with the extra warming already locked in by the CO2 levels we now have. In other words, there is a significant time lag involved as the warming catches up with the CO2 level. Or as it is sometimes put, there is a built in warming already in the system that we can't avoid, even if we were to stop adding more CO2 today. This is what the scientists try to calculate with their computer models. Many think that in order to avoid a two degree rise (and certainly a 1.5 degree rise) we will not only have to urgently stop producing CO2, but we probably will have to reduce the amount in the atmosphere somehow - and that will not be easy or risk free - anything but. And VERY expensive.
More evidence from the past
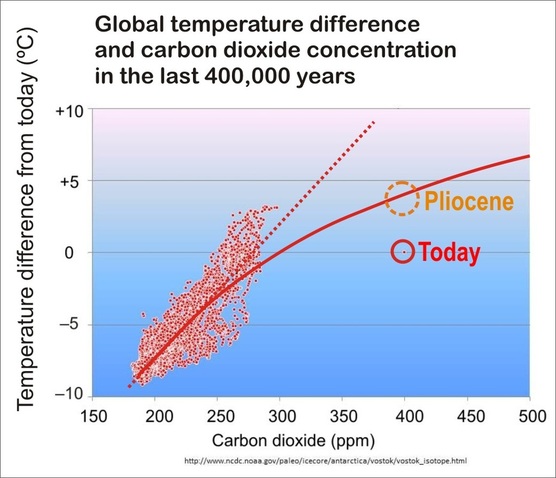
Here is another way of looking at what is essentially the same problem. All the red dots on this diagram represent measurements of the CO2 levels and the corresponding change in average temperatures over the last 400,000 years. There is clearly quite a strong straight line relationship between them - with one notable exception! Today the CO2 is 400 ppm, but the temperature is not in line with the rest of the data. The reason is most likely that it simply hasn't had time to catch up. Other factors may come into it as well, but we have to expect that if the CO2 level stays at 400 ppm, the temperature must rise considerably. If you simply draw a line up from today to the red dotted line, and then across to the temperature axis you can find the temperature rise we might expect, other things being equal. It's pretty scary!
A better way of getting an estimate of the temperature we should expect with around 400 ppm CO2 is to look back in time to when CO2 levels were last this high. That was the Pliocene period (around 3 to 4 million years ago) and is shown by the dotted circle. We have also drawn a curve suggesting the possible long term relationship between temperatures and carbon dioxide concentrations.
However we look at this data it is pretty clear that if CO2 levels stay at over 400 ppm for long the temperature will increase. Whether it will be by 3 or 4 degrees or by much more is uncertain. What is clear is that we have not reached an 'equilibrium' temperature for this level of CO2. This is hardly surprising. The climate system has huge inertia built in as the thermal mass of the oceans is enormous and it will take a long time for the extra heat that is pouring into the Earth to heat it up. And that is assuming the CO2 stays at 400 ppm - which of course it won't. The bad news is that, as we have seen, sea levels were around 20 to 40 metres higher in the Pliocene - that's not good news.
One last clue from the past is to look at previous interglacials. As you can see (on the 'Temperature and Carbon dioxide in Antarctica' graph above) the last one 150,000 years ago, was slightly warmer than the current one (only by one or two degrees) but at that time sea levels were something like 5 to 10 metres higher. The other worrying thing is that geologists have found that during that interglacial, sea levels rose at up to 3 metres per century - and that was without the added greenhouse forcing that we have now. One can only imagine the chaos that would cause if it happened this century. There is more about melting ice and possible sea level rises in the ' Climate 3: Does it matter ' section.
So yes, climate change IS natural, BUT ...
The message from all this is that, yes, climate change is natural, but the small changes we have seen over the period of human civilisation are nothing compared to what the Earth's climate can do - and has done in the past. As Earth came out of the last ice age around 20,000 years ago sea levels rose by around 100 metres in 10,000 years. That's 1 metre per century average, but there were stages where that was more like 3 metres per century. But that was only under quite small rises in greenhouse gases. We have increased them by over 40% which is way beyond anything 'natural'. It is hard to imagine that this won't increase temperatures and sea levels at a greater rate than happened in the 'natural' change from ice age to the current interglacial.
And so what do we find? In the blink of a geological eye we have rocketed from a slow decline in temperatures to an extremely rapid (geologically speaking) rise - which shows no sign of slowing. Indeed quite the reverse. In fact, the current rate of temperature increase is almost 100 times that of the rise from the last ice age .
Clearly. past climate changes have been 'natural', that is, obviously not caused by humans. So how can we be sure that the changes we are seeing at present are not 'natural', or at least the result of some non-human factors? And if the Earth has survived past climate changes, won't it do so again? In the first section we saw that the level of CO2 in the atmosphere has increased over the last century or so - and there seemed to be no explanation other than our use of fossil fuels. But lack of evidence for other factors is not proof that it was fossil fuels. So is there some way we can be sure?
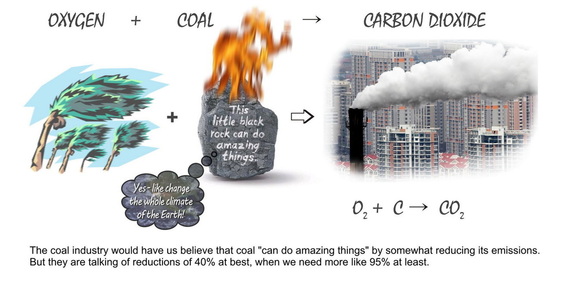
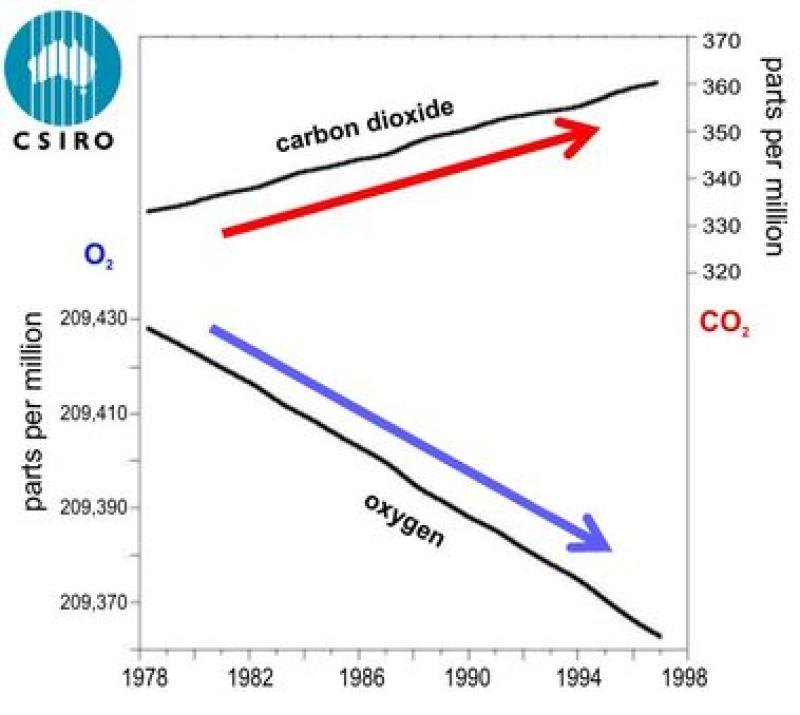
When coal, or other fossil fuels are burnt in air, the oxygen in the air combines with the carbon in the coal to form carbon dioxide. So clearly, if the added carbon dioxide in the air is due to burning carbon in fossil fuels the amount of oxygen in the air should be decreasing. In fact every carbon atom joins up with two oxygen atoms so the oxygen should be decreasing at twice the rate of carbon dioxide increase.
(The coal industry like to suggest we can do it better - but the inevitable chemistry is that burning coal produces carbon dioxide. There is no way around it! Perhaps it could be captured and stored - CCS - but that looks very expensive compared to other solutions)
(The coal industry like to suggest we can do it better - but the inevitable chemistry is that burning coal produces carbon dioxide. There is no way around it! Perhaps it could be captured and stored - CCS - but that looks very expensive compared to other solutions)
... this time it's us!
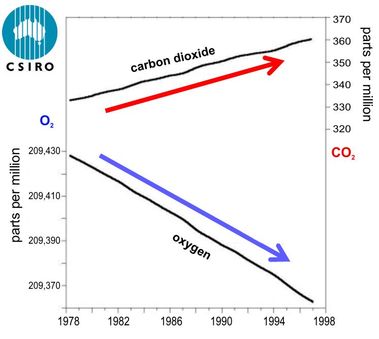
Now scientists at the CSIRO realised this some time back and decided to check. Their results are shown in this graph. Indeed they found that the amount of oxygen in the air was decreasing at just the rate expected - twice that at which the carbon dioxide was increasing.
This means of course that the amount of oxygen in the air is decreasing. Now before you start worrying about not being able to breathe, this is not a problem! The amount of oxygen in the air is around 20% compared to the 0.04% of CO2 so we are not going to suffocate any time soon! However this loss of oxygen is quite easily measurable (with the right equipment!) and sure enough, it corresponds to exactly the oxygen used in burning the fossil fuels. Clear proof that it is our burning of fossil fuels that is responsible for the extra CO2 in the air.
Yet more evidence comes from analysing the isotopic composition of the C in the atmosphere. This just means looking at the sorts of carbon atoms in the carbon dioxide. Not all carbon atoms are the same. There are what are called C12, C13 and C14 atoms (they are called different 'isotopes' of carbon). Now it turns out that due to the interaction of cosmic rays with air, the CO2 in the air has a small proportion of the C14 atoms. However, these are radioactive and decay after a few thousand years. So if a tree grows, using CO2 of course, it initially has the same proportion of C14 as the air. But after a few million years in the ground, as it turns into coal, oil or gas, most of the C14 atoms decay. So when coal is burnt, the CO2 that goes into the air has a lower proportion of C14 atoms. This lowers the overall proportion of C14 atoms in the air - and this is exactly what we find has happened over the last century or so as we have been burning fossil fuels. So yet more evidence (if it was needed) that it is our burning of fuels that is producing the extra CO2 in the atmosphere. (By the way, this gradual loss of C14 is the basis of 'carbon dating' by which scientists can date old remains of plant matter.)
There are other ways of studying the isotopic composition of the air that go to reinforce these conclusions. There is a lot more on this at Skeptical Science and at Real Climate .
So, to imagine that somehow the extra roughly 20 billion tonnes of CO2 that are appearing in the atmosphere every year is not the result of the approximately 40 billion tonnes or so that we are putting into the atmosphere every year by burning fossil fuels really does beggar belief. The science is very clear. And of course most of the other half of the 40 billion tonnes is going into the ocean - making it more acidic and thus threatening ocean life and coral reefs. (Strictly speaking it is making the ocean 'less alkaline' - but it amounts to the same thing and has the same effect.)
So to sum up , there is no serious scientific doubt that our climate is changing and it is the result of our use of fossil fuels. The next question then is "Does it matter?" From what we have seen above, clearly we have to expect warmer climates and rising seas. And clearly these changes will be something not experienced by the Earth for well over a million years. There is then, every reason to believe that, yes, it will matter .




The site from which I seeded this, Climate Science for Sceptics , is an excellent reference site for amateurs like myself. This is just one of several web-pages. The others are:
What determines our climate?
Does it matter?
The physics of climate science
Websites and References