Dow Jones - DJIA - 100 Year Historical Chart | MacroTrends
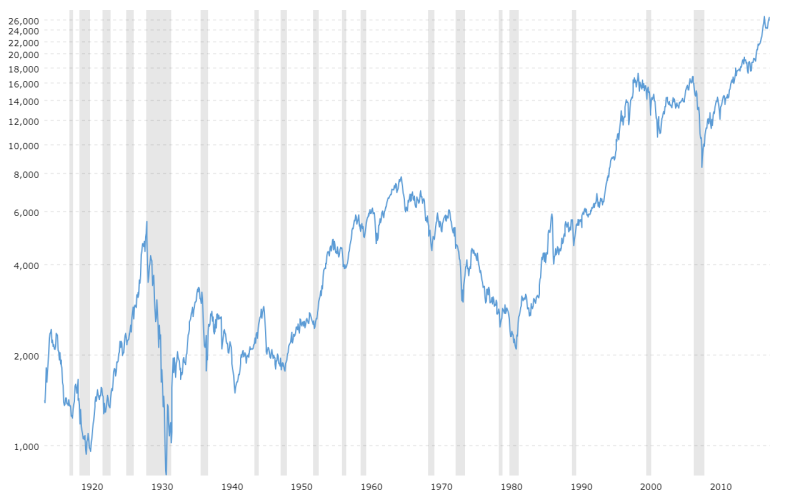

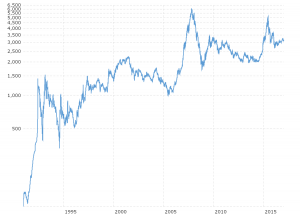
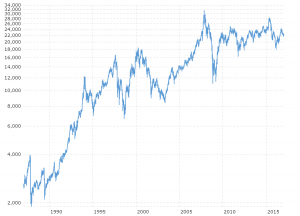
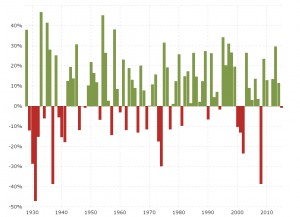
Interactive chart of the Dow Jones Industrial Average (DJIA) stock market index for the last 100 years. Historical data is inflation-adjusted using the headline CPI and each data point represents the month-end closing value. The current month is updated on an hourly basis with today's latest value.
Interactive chart of the Dow Jones Industrial Average (DJIA) stock market index for the last 100 years. Historical data is inflation-adjusted using the headline CPI and each data point represents the month-end closing value. The current month is updated on an hourly basis with today's latest value. The current price of the Dow Jones Industrial Average as of July 19, 2023 is 35,061.21 .
| Dow Jones Industrial Average - Historical Annual Data | ||||||
|---|---|---|---|---|---|---|
| Year | Average Closing Price |
Year Open | Year High | Year Low | Year Close | Annual % Change |
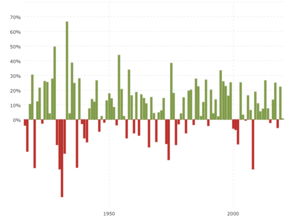
| 2023 | 33,513.57 | 33,136.37 | 35,061.21 | 31,819.14 | 35,061.21 | 5.77% |
| 2022 | 32,898.34 | 36,585.06 | 36,799.65 | 28,725.51 | 33,147.25 | -8.78% |
| 2021 | 34,055.29 | 30,223.89 | 36,488.63 | 29,982.62 | 36,338.30 | 18.73% |
| 2020 | 26,890.67 | 28,868.80 | 30,606.48 | 18,591.93 | 30,606.48 | 7.25% |
| 2019 | 26,379.59 | 23,346.24 | 28,645.26 | 22,686.22 | 28,538.44 | 22.34% |
| 2018 | 25,046.86 | 24,824.01 | 26,828.39 | 21,792.20 | 23,327.46 | -5.63% |
| 2017 | 21,750.20 | 19,881.76 | 24,837.51 | 19,732.40 | 24,719.22 | 25.08% |
| 2016 | 17,927.11 | 17,148.94 | 19,974.62 | 15,660.18 | 19,762.60 | 13.42% |
| 2015 | 17,587.03 | 17,832.99 | 18,312.39 | 15,666.44 | 17,425.03 | -2.23% |
| 2014 | 16,777.69 | 16,441.35 | 18,053.71 | 15,372.80 | 17,823.07 | 7.52% |
| 2013 | 15,009.52 | 13,412.55 | 16,576.66 | 13,328.85 | 16,576.66 | 26.50% |
| 2012 | 12,966.44 | 12,397.38 | 13,610.15 | 12,101.46 | 13,104.14 | 7.26% |
| 2011 | 11,957.57 | 11,670.75 | 12,810.54 | 10,655.30 | 12,217.56 | 5.53% |
| 2010 | 10,668.58 | 10,583.96 | 11,585.38 | 9,686.48 | 11,577.51 | 11.02% |
| 2009 | 8,885.65 | 9,034.69 | 10,548.51 | 6,547.05 | 10,428.05 | 18.82% |
| 2008 | 11,244.06 | 13,043.96 | 13,058.20 | 7,552.29 | 8,776.39 | -33.84% |
| 2007 | 13,178.26 | 12,474.52 | 14,164.53 | 12,050.41 | 13,264.82 | 6.43% |
| 2006 | 11,409.78 | 10,847.41 | 12,510.57 | 10,667.39 | 12,463.15 | 16.29% |
| 2005 | 10,546.66 | 10,729.43 | 10,940.55 | 10,012.36 | 10,717.50 | -0.61% |
| 2004 | 10,315.51 | 10,409.85 | 10,854.54 | 9,749.99 | 10,783.01 | 3.15% |
| 2003 | 9,006.64 | 8,607.52 | 10,453.92 | 7,524.06 | 10,453.92 | 25.32% |
| 2002 | 9,214.85 | 10,073.40 | 10,635.25 | 7,286.27 | 8,341.63 | -16.76% |
| 2001 | 10,199.29 | 10,646.15 | 11,337.92 | 8,235.81 | 10,021.57 | -7.10% |
| 2000 | 10,729.38 | 11,357.51 | 11,722.98 | 9,796.03 | 10,787.99 | -6.17% |
| 1999 | 10,481.56 | 9,184.27 | 11,497.12 | 9,120.67 | 11,497.12 | 25.22% |
| 1998 | 8,630.76 | 7,965.00 | 9,374.27 | 7,539.07 | 9,181.43 | 16.10% |
| 1997 | 7,447.01 | 6,442.49 | 8,259.30 | 6,391.70 | 7,908.30 | 22.64% |
| 1996 | 5,739.63 | 5,177.45 | 6,560.91 | 5,032.94 | 6,448.27 | 26.01% |
| 1995 | 4,494.28 | 3,838.48 | 5,216.47 | 3,832.08 | 5,117.12 | 33.45% |
| 1994 | 3,794.22 | 3,756.60 | 3,978.36 | 3,593.35 | 3,834.44 | 2.14% |
| 1993 | 3,524.92 | 3,309.20 | 3,794.33 | 3,242.00 | 3,754.09 | 13.72% |
| 1992 | 3,284.08 | 3,172.40 | 3,413.20 | 3,136.60 | 3,301.11 | 4.17% |
| 1991 | 2,929.04 | 2,610.64 | 3,168.83 | 2,470.30 | 3,168.83 | 20.32% |
| 1990 | 2,679.45 | 2,810.15 | 2,999.75 | 2,365.10 | 2,633.66 | -4.34% |
| 1989 | 2,510.33 | 2,144.64 | 2,791.41 | 2,144.64 | 2,753.20 | 26.96% |
| 1988 | 2,061.48 | 2,015.25 | 2,183.50 | 1,879.14 | 2,168.57 | 11.85% |
| 1987 | 2,277.53 | 1,927.31 | 2,722.42 | 1,738.74 | 1,938.83 | 2.26% |
| 1986 | 1,793.10 | 1,537.73 | 1,955.57 | 1,502.29 | 1,895.95 | 22.58% |
| 1985 | 1,327.99 | 1,198.87 | 1,553.10 | 1,184.96 | 1,546.67 | 27.66% |
| 1984 | 1,178.59 | 1,252.74 | 1,286.64 | 1,086.57 | 1,211.57 | -3.74% |
| 1983 | 1,190.78 | 1,027.04 | 1,287.20 | 1,027.04 | 1,258.64 | 20.27% |
| 1982 | 884.53 | 882.52 | 1,070.55 | 776.92 | 1,046.54 | 19.60% |
| 1981 | 932.95 | 972.78 | 1,024.05 | 824.01 | 875.00 | -9.23% |
| 1980 | 891.14 | 824.57 | 1,000.17 | 759.13 | 963.99 | 14.93% |
| 1979 | 844.38 | 811.42 | 897.61 | 796.67 | 838.74 | 4.19% |
| 1978 | 821.13 | 817.74 | 907.74 | 742.12 | 805.01 | -3.15% |
| 1977 | 894.37 | 999.75 | 999.75 | 800.85 | 831.17 | -17.27% |
| 1976 | 975.20 | 858.71 | 1,014.79 | 858.71 | 1,004.65 | 17.86% |
| 1975 | 802.89 | 632.04 | 881.81 | 632.04 | 852.41 | 38.32% |
| 1974 | 759.13 | 855.32 | 891.66 | 577.60 | 616.24 | -27.57% |
| 1973 | 924.07 | 1,031.68 | 1,051.70 | 788.31 | 850.86 | -16.58% |
| 1972 | 950.08 | 889.30 | 1,036.27 | 889.15 | 1,020.02 | 14.58% |
| 1971 | 884.87 | 830.57 | 950.82 | 797.97 | 890.20 | 6.11% |
| 1970 | 753.12 | 809.20 | 842.00 | 631.16 | 838.92 | 4.82% |
| 1969 | 875.72 | 947.73 | 968.85 | 769.93 | 800.36 | -15.19% |
| 1968 | 903.96 | 906.84 | 985.21 | 825.13 | 943.75 | 4.27% |
| 1967 | 879.48 | 786.41 | 943.08 | 786.41 | 905.11 | 15.20% |
| 1966 | 872.78 | 968.54 | 995.15 | 744.32 | 785.69 | -18.94% |
| 1965 | 910.70 | 869.78 | 969.26 | 840.59 | 969.26 | 10.88% |
| 1964 | 834.09 | 766.08 | 891.71 | 766.08 | 874.13 | 14.57% |
| 1963 | 714.69 | 646.79 | 767.21 | 646.79 | 762.95 | 17.00% |
| 1962 | 639.14 | 724.71 | 726.01 | 535.76 | 652.10 | -10.81% |
| 1961 | 691.74 | 610.25 | 734.91 | 610.25 | 731.14 | 18.71% |
| 1960 | 618.02 | 679.06 | 685.47 | 566.05 | 615.89 | -9.34% |
| 1959 | 632.57 | 587.59 | 679.36 | 574.46 | 679.36 | 16.40% |
| 1958 | 491.26 | 439.27 | 583.65 | 436.89 | 583.65 | 33.96% |
| 1957 | 476.07 | 496.03 | 520.77 | 419.79 | 435.69 | -12.77% |
| 1956 | 493.21 | 485.78 | 521.05 | 462.35 | 499.47 | 2.27% |
| 1955 | 442.69 | 408.89 | 488.40 | 388.20 | 488.40 | 20.77% |
| 1954 | 334.34 | 282.89 | 404.39 | 279.87 | 404.39 | 43.96% |
| 1953 | 275.84 | 292.14 | 293.79 | 255.49 | 280.90 | -3.77% |
| 1952 | 270.35 | 269.86 | 292.00 | 256.35 | 291.90 | 8.42% |
| 1951 | 257.41 | 239.92 | 276.37 | 238.99 | 269.23 | 14.37% |
| 1950 | 216.28 | 198.89 | 235.47 | 196.81 | 235.41 | 17.63% |
| 1949 | 179.67 | 175.03 | 200.52 | 161.60 | 200.13 | 12.88% |
| 1948 | 179.78 | 181.04 | 193.16 | 165.39 | 177.30 | -2.13% |
| 1947 | 177.48 | 176.39 | 186.85 | 163.21 | 181.16 | 2.23% |
| 1946 | 191.52 | 191.66 | 212.50 | 163.12 | 177.20 | -8.14% |
| 1945 | 169.66 | 152.58 | 195.82 | 151.35 | 192.91 | 26.65% |
| 1944 | 143.32 | 135.92 | 152.53 | 134.22 | 152.32 | 12.09% |
| 1943 | 134.92 | 119.93 | 145.82 | 119.26 | 135.89 | 13.81% |
| 1942 | 107.15 | 112.77 | 119.71 | 92.92 | 119.40 | 7.61% |
| 1941 | 121.93 | 130.57 | 133.59 | 106.34 | 110.96 | -15.38% |
| 1940 | 134.64 | 151.43 | 152.80 | 111.84 | 131.13 | -12.72% |
| 1939 | 142.57 | 153.64 | 155.92 | 121.44 | 150.24 | -2.92% |
| 1938 | 132.36 | 120.57 | 158.41 | 98.95 | 154.76 | 28.06% |
| 1937 | 166.45 | 178.52 | 194.40 | 113.64 | 120.85 | -32.82% |
| 1936 | 162.07 | 144.13 | 184.90 | 143.11 | 179.90 | 24.82% |
| 1935 | 120.35 | 104.51 | 148.44 | 96.71 | 144.13 | 38.53% |
| 1934 | 98.16 | 100.36 | 110.74 | 85.51 | 104.04 | 4.14% |
| 1933 | 84.50 | 59.29 | 108.67 | 50.16 | 99.90 | 66.69% |
| 1932 | 64.53 | 74.62 | 88.78 | 41.22 | 59.93 | -23.07% |
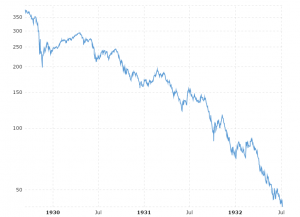
| 1931 | 138.60 | 169.84 | 194.36 | 73.79 | 77.90 | -52.67% |
| 1930 | 236.04 | 244.20 | 294.07 | 157.51 | 164.58 | -33.77% |
| 1929 | 313.54 | 307.01 | 381.17 | 198.69 | 248.48 | -17.17% |
| 1928 | 226.17 | 203.35 | 300.00 | 191.33 | 300.00 | 49.48% |
| 1927 | 176.07 | 155.16 | 200.93 | 152.73 | 200.70 | 27.67% |
| 1926 | 153.00 | 151.08 | 166.14 | 135.20 | 157.20 | 4.05% |
| 1925 | 134.40 | 121.25 | 159.39 | 115.00 | 151.08 | 25.37% |
| 1924 | 99.65 | 95.65 | 120.51 | 88.33 | 120.51 | 26.16% |
| 1923 | 94.87 | 98.77 | 105.38 | 85.91 | 95.52 | -2.70% |
| 1922 | 93.24 | 78.91 | 102.76 | 78.59 | 98.17 | 21.50% |
| 1921 | 73.39 | 72.67 | 81.50 | 63.90 | 80.80 | 12.30% |
| 1920 | 90.01 | 107.23 | 108.85 | 66.75 | 71.95 | -32.90% |
| 1919 | 99.79 | 82.60 | 119.62 | 79.35 | 107.23 | 30.45% |
| 1918 | 80.97 | 76.68 | 89.07 | 73.38 | 82.20 | 10.51% |
| 1917 | 87.87 | 96.15 | 99.18 | 65.95 | 74.38 | -21.71% |
| 1916 | 95.27 | 98.81 | 110.15 | 86.42 | 95.00 | -4.19% |
| 1915 | 74.45 | 54.63 | 99.21 | 54.22 | 99.15 | 81.49% |
Related Charts 


| ) | |
|---|---|

Tags
Who is online


41 visitors
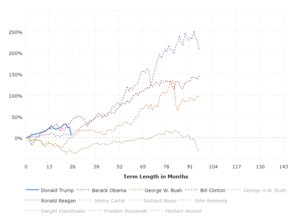
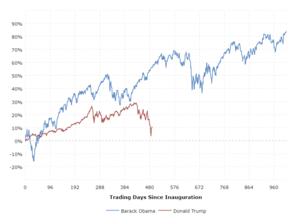
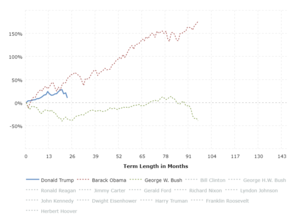
Markets are closing in on historical highs also reached previously in the Biden administration.
Recession avoided, lowering inflation, historically low unemployment, rising wages and businesses booming Biden's economy is looking good today!
Aren't we better off than we were in 2020? Yes!
Only if you completely ignore reality.
Yes, things are way worse in Moscow and St Petersburg, but not in Biden's America!