What Plants Will Survive in Your Garden? This Map Plans for a Warmer U.S.
Category: Environment/Climate
Via: hallux • 2 years ago • 5 commentsBy: Remy Tumin and Mike Ives - NYT
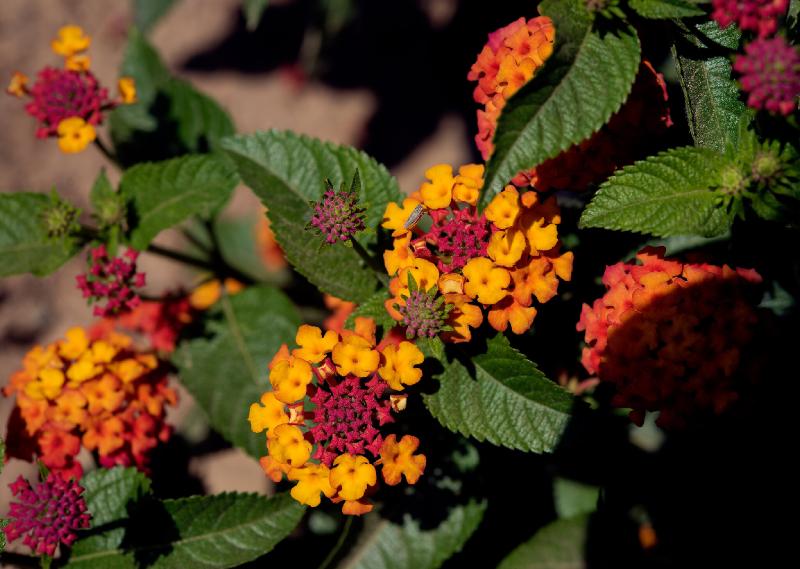

Jason Reeves has been using the lantana, a flowering shrub , as a perennial in garden beds for the past few years. That was not the case a decade ago, when the plant would have died in the Tennessee winters.
Now, the U.S. Department of Agriculture has made official what Mr. Reeves and countless other gardeners and horticulturists have known for some time: Americans are adapting to warming weather, right in their backyards.
“Nothing has really changed,” said Mr. Reeves, a landscape consultant and a horticulturist at the University of Tennessee’s West Tennessee AgResearch and Education Center in Jackson, Tenn. “We’re just seeing it on paper.”
The U.S.D.A. updated its Plant Hardiness Zone Map last week for the first time in more than a decade, showing that about half the United States had moved into a slightly warmer zone. The hardiness map is considered the gold-standard resource for understanding which perennials thrive and where. The map divides the country into color-coded zones, each indicating the average low temperature of the year for that area.
“It’s not a forecast,” he said. “It’s what happened in the past as best as we’re able to describe it.”

The map is based on the 30-year average of the lowest annual winter temperatures for specific places. It is divided into 13 zones, each reflecting a 10-degree temperature range, and each zone is divided into two half zones, designated as A and B.
The coldest area, as low as negative 60 degrees Fahrenheit, applies to remote regions of Alaska. The warmest, as high as at 70 degrees, covers coastal areas of Puerto Rico.
Some zone changes reflected how data was collected, he said, which included the use of more weather stations and increasingly sophisticated mapping methods, right down to the ZIP code.
Art DeGaetano, the director of the Northeast Regional Climate Center at Cornell University, said that it can be hard to use an extreme number, like a historical average of a region’s coldest winter temperature, to model climate change over time.
The warming reflected on the updated map, however, is “very much in line with, over the long term, what we would expect to see from climate change,” he said. “Not every cold temperature is going to get warmer, but on average, things will get warmer.”
This is not the first version of the map to show planting zones shifting northward as winters become more mild. When the Agriculture Department released a 2012 version of the map, most areas of the country had shifted one half zone from the 1990 version.
Among other uses, the plant hardiness map has applications in commercial agriculture and is used by the department’s Risk Management Agency to set some crop insurance standards.
But gardeners are its most frequent users, and for good reason: They need to know which zone they’re in because winter temperatures will play a major role in determining which perennials will survive to spring, which ones should be taken inside and which ones should not be planted in the first place.
Signs of adaptation are easy to find. In the New York metropolitan area , for example, some native plants, like sugar maples, are becoming less prevalent as temperatures rise. At the same time, some plants from the South, including camellias, the state flower of Alabama, have started to bloom at the New York Botanical Garden.
Jason D. Lanier, an extension specialist at the University of Massachusetts Amherst, said the shift in the map, while minor compared with the one a decade ago, reflects longer and larger changes.
“If you talk about this in increments of a hundred years, based on what we’re seeing now, we’re seeing significant differences in these hardiness zones,” he said.
“We’re dealing with living things so nothing is hard and fast,” he said. “This is an attempt to get as close as we can to some real sort of go-to useful advice.”
That’s exactly how Mr. Reeves, who lives in Clarksburg, Tenn., is thinking about it.
“Nothing has changed overnight,” he said. If gardeners want to push their limits on new zones a little bit, he added, they should do so in the spring and early summer, and give the plants a chance to take root before winter.
“Just keep on planting,” he said.
Tags
Who is online


55 visitors
Green thumbs good, red thumbs bad.
I had a Rose of Sharon for years but it died last winter. I don't know if it was the weather or the fact that it was competing with a sweet gum and an oak
Perhaps it died from old age.
It wasn't that old. Maybe 20 years at most. those things live forever
A customer, who was very interested in my shallow office aquarium earlier this week, just dropped off 2 large ficus trees.