
Analysis of uncontested elections, 2026

By: Ballotpedia

Some nitty & gritty to put some of the partisan hype in perspective. When 2/3 of local, state, and Federal elections are uncontested the partisan ravings about 'democracy' sound pretty lame.
 S E E D E D C O N T E N T
Throughout 2026, this page will display monthly statistics regarding the number and percentage of uncontested and contested elections covered by Ballotpedia.
An uncontested election is one where the number of candidates on the ballot is less than or equal to the number of seats up for election. Candidates running in uncontested elections are virtually guaranteed victory. On average, between 2018 and 2025, 64.9% of elections covered by Ballotpedia were uncontested, ranging from a low of 49.3% in 2021 to a high of 69.6% in 2024.
Through August 2026, Ballotpedia has covered 40,800 elections in 50 states, the District of Columbia, and two territories . Of that total, 28,032 (68.7%) were uncontested and 12,768 (31.3%) were contested .
The current year-to-date rate of 68.7% is below the median among the nine years included in the analysis. The lowest rate was 54.3% in 2019. The highest rate of uncontested elections was 77.8% in 2020.
This analysis includes offices at all levels of government, excluding the presidency. Through August 2026, 3,339 of 4,108 (81.3%) local judge elections Ballotpedia has covered have been uncontested which is the highest uncontested rates among any office type. School board elections have the lowest uncontested rates at 54.4% — that is 1,717 of the 3,159 elections covered so far.
The figures shown on this page are limited to elections within Ballotpedia's coverage scope, which has expanded over time. Click here to learn more about the scope of coverage in this analysis. Click here to view the limitations of this analysis.
On this page you will find figures :
- Year-to-date through August 2026
- By month
Year-to-date
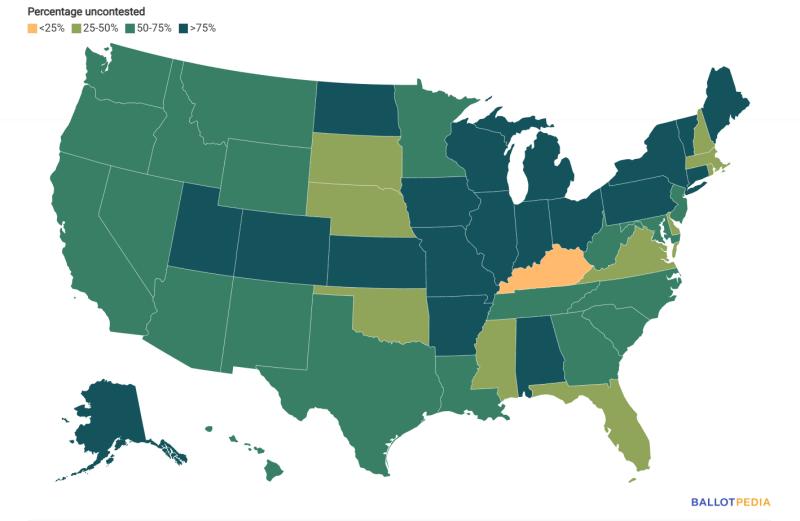
Through August 2026, Ballotpedia has covered 40,800 elections in 50 states, the District of Columbia, and two territories . Of that total, 28,032 (68.7%) were uncontested and 12,768 (31.3%) were contested .
[ See data table in seed article ]
Historical comparison
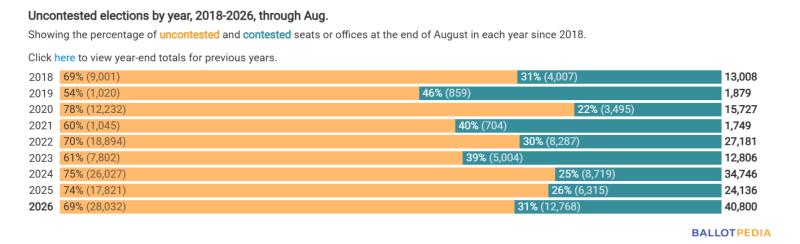
On average, between 2018 and 2025, 64.9% of elections covered by Ballotpedia were uncontested, ranging from a low of 49.3% in 2021 to a high of 69.6% in 2024.
The current year-to-date rate of 68.7% is below the median among the nine years included in the analysis. The lowest rate was 54.3% in 2019. The highest rate of uncontested elections was 77.8% in 2020.
By month
Last updated: Sept. 2, 2026
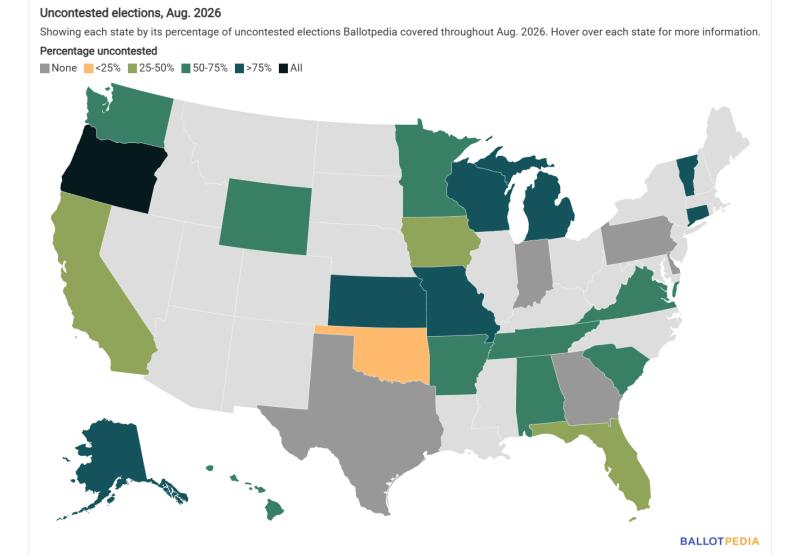
Ballotpedia covered 5,965 elections in 28 states and two territories in August. Of that total, 4,190 (70.2%) were uncontested and 1,775 (29.8%) were contested .
[ See data table in seed article ]
Scope and limitations
Scope
See also: Election coverage approach for Ballotpedia
The scope of this analysis includes all elections within Ballotpedia's regular coverage scope , excluding the presidency. As of 2024, this included all congressional, state executive, state judicial, and state legislative elections. It also included local elections in the 100 largest U.S. cities by population and each state capital, as well as elections in 475 school districts.
Ballotpedia has also expanded its coverage scope over time. In 2026, this includes comprehensive election coverage in the following states, each of which is represented in this year's analysis: Arizona, Arkansas, California, Delaware, Florida, Georgia, Hawaii, Idaho, Illinois, Iowa, Indiana, Kentucky, Maine, Michigan, Minnesota, Montana, New Mexico, Nevada, North Carolina, Ohio, Oklahoma, Oregon, Pennsylvania, Rhode Island, South Carolina, South Dakota, Texas, Virginia, Washington, Wisconsin, and Wyoming. Previous years' data may also include instances of expanded coverage beyond our regular coverage scopes in states both listed and not listed here.
Limitations
It is likely that this analysis underestimates the actual number of uncontested elections.
In some states or for some office types, uncontested elections are canceled , meaning they do not appear on any ballots and are often excluded from other election-related materials including public notices and candidate lists. While Ballotpedia attempts to identify these elections and their winners through direct outreach to election officials, this is not always possible or feasible. The uncontested elections in this analysis are those Ballotpedia was able to identify regardless of whether they were ultimately canceled.
Additionally, this analysis does not include elections where no candidates filed to run.
See also
- Ballotpedia's Election Analysis Hub, 2026
- Elections by state and year
- Analysis of uncontested elections, 2025
Be a good human. Grossly derogatory comments, blatantly inflammatory comments, excessive trolling, mean-spirited taunting and insults, scamming, spamming, and off topic comments may be removed in compliance with the site's Terms of Service and the Code of Conduct. The moderators have the final word.

Tags
Who is online

158 visitors
Check this out:
This doesn't sound like 'democracy' serving the voting public.