
MAPS TwoFer!




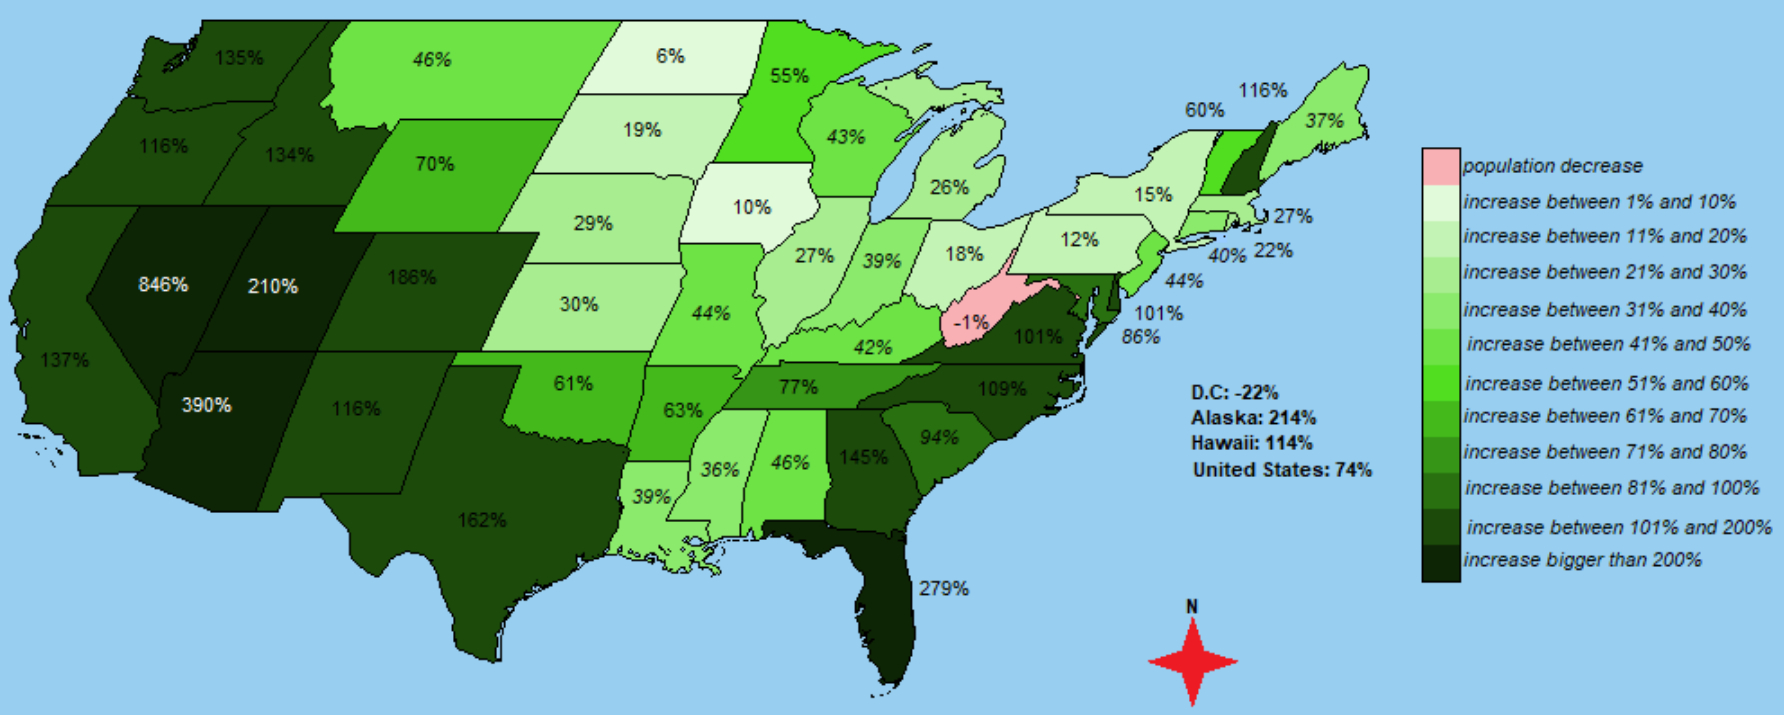
The population growth map seems pretty logical:
- people leaving harsh climate in search of more temperate.
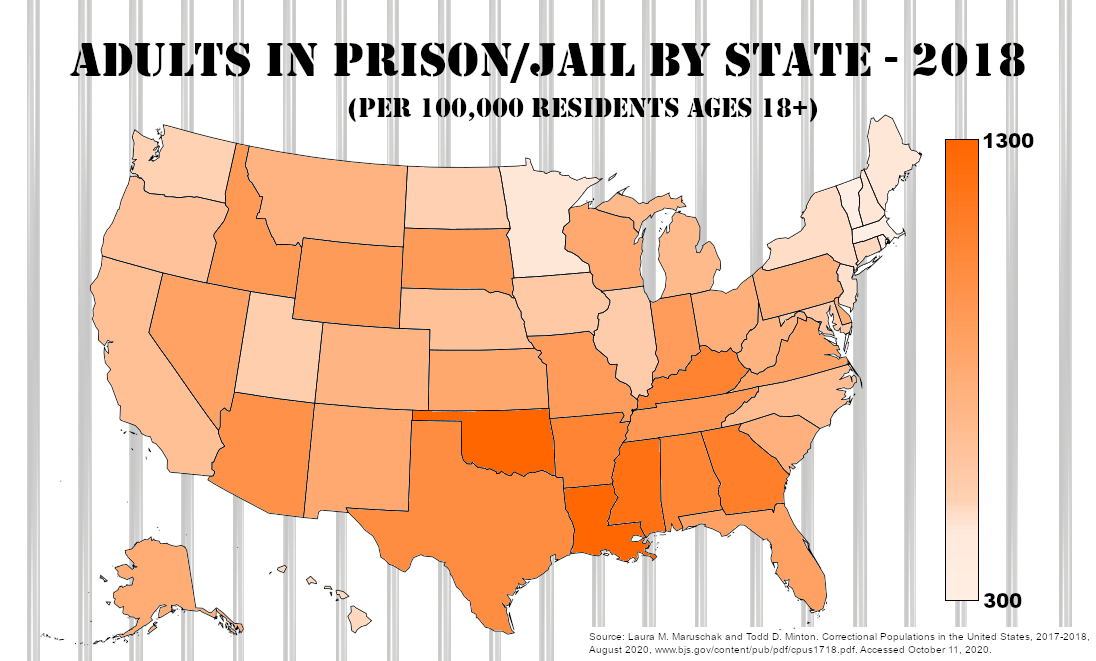
The prison population makes no sense... on the surface.
- Surely Oklahomans are not so much more criminal than
the rest of us!
- But then... prisons are filled according to the severity of the
courts, rather than the extent of criminality...
Your thoughts?
US population growth between 1960 and 2010
Correctional Populations in the United States, 2018
Tags
Who is online

98 visitors
Bonus!
Yeah, okay... it has nothing to do with anything... but it's kinda cool!
It was interesting to read that the pct of adults incarcerated has fallen to levels not seen since 1996. If asked... I would have guessed wrong.
Where do you see that? It deserves a seed.
I'll seed something tomorrow. This data shows a decline during the Obama Administration, after a long period of increasing incarceration. I'll try to find something for the last four years.
It's in your chart, which led me to this... Correctional Populations In The United States, 2017-2018
Some of the oddities in the chart might be federal prisons in lower population states. It is a job creation thing.
Thanks for the data. I'll do a little research, later, and seed something.
Many more people and Florida is going to sink.
Florida was already a populous state.
Gonna get crowded...