
ACA a huge success number of uninsured drops a whopping 1.2% since fourth quarter of 2013


U.S. Uninsured Rate Continues to Fall
Uninsured rate drops most among lower-income and black Americans (2.8%)
WASHINGTON, D.C. -- The percentage of Americans without health insurance continues to fall, measuring 15.9% so far in 2014 compared with 17.1% in the fourth quarter of 2013.

These data are based on more than 28,000 interviews with Americans from Jan. 2-Feb. 28, 2014, as part of the Gallup-Healthways Well-Being Index. With only a few weeks remaining in the first quarter, the uninsured rate is on track to be the lowest quarterly level that Gallup and Healthways have measured since 2008.
The uninsured rate has been declining since the fourth quarter of 2013, after hitting an all-time high of 18.0% in the third quarter. The uninsured rate for the first quarter of 2014 so far includes a 16.2% reading for January and 15.6% for February.
Uninsured Rate Declines Most Among Lower-Income and Black Americans
The uninsured rate for almost every major demographic group has dropped in 2014 so far. The percentage of uninsured Americans with an annual household income of less than $36,000 has dropped the most -- by 2.8 percentage points -- to 27.9% since the fourth quarter of 2013, while the percentage of uninsured blacks has fallen 2.6 points to 18.3%. Hispanics remain the subgroup most likely to lack health insurance, with an uninsured rate of 37.9%.
The percentage of uninsured has declined across all age groups this year, except for those aged 65 and older. The uninsured rate for that group has likely remained stable because most Americans aged 65 and older have Medicare.
The uninsured rate among 26- to 34-year olds and 35- to 64-year olds continues to decline -- now at 26.6% and 16.3%, respectively. The February Enrollment Report released by the Department of Health and Human Services (HHS) highlighted no significant changes in young adults' enrollment in the health exchanges since its December report, with the cumulative total enrollment rate among 18- to 34-year-olds hovering at 25%. The Obama administration has made young adults' enrollment in a health insurance plan a top priority, as healthcare experts say 40% of new enrollees must be young and healthy for the Affordable Care Act to be successful.

Fewer Americans Get Primary Coverage Through Employer
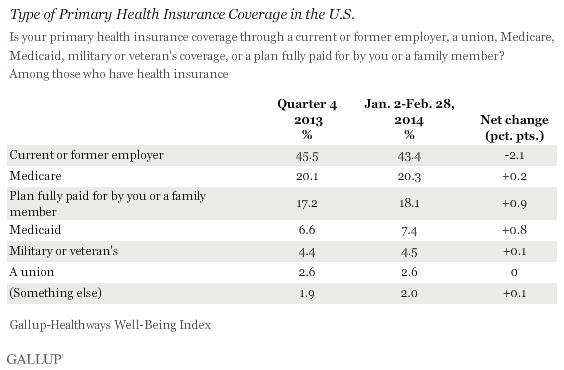
The percentage of Americans who get insurance through a current or former employer fell nearly two points so far in the first quarter of 2014 to 43.4%. More Americans now say their primary health insurance coverage is through a plan fully paid for by themselves or a family member compared with at the end of 2013 -- 18.1% vs. 17.2%. The percentage who say they are covered primarily through Medicaid is also up slightly, likely because some states have chosen to expand Medicaid coverage.
Implications
The uninsured rate continues to decline after the requirement to have health insurance went into effect on Jan. 1, 2014. This drop could be a result of the ACA, which aims to provide healthcare coverage to more Americans through multiple provisions, including federal and state healthcare marketplaces where Americans can purchase health insurance coverage at competitive rates.
At the end of February, HHS reported 4 million people have signed up for health insurance coverage through the marketplaces established under the ACA. With the open enrollment period scheduled to close on March 31, the uninsured rate in the U.S. will likely continue to fall. Additionally, healthcare aides in the Obama administration announced on Wednesday that Americans will be able to renew old health insurance plans for up to three years, even if the plans do not comply with ACA policies. Other provisions of the healthcare law have not yet gone into effect, such as the requirement for employers to provide health insurance to their employees by 2015 or 2016. These provisions also may affect the uninsured rate over time.
Gallup will continue to track the U.S. uninsured rate in the weeks and months ahead.
Survey Methods
Results are based on telephone interviews conducted as part of the Gallup-Healthways Well-Being Index survey Jan. 2-Feb. 28, 2014, with a random sample of 28,396 adults, aged 18 and older, living in all 50 U.S. states and the District of Columbia.
For results based on the total sample of national adults, the margin of sampling error is 1 percentage points at the 95% confidence level.
Interviews are conducted with respondents on landline telephones and cellular phones, with interviews conducted in Spanish for respondents who are primarily Spanish-speaking. Each sample of national adults includes a minimum quota of 50% cellphone respondents and 50% landline respondents, with additional minimum quotas by time zone within region. Landline and cellular telephone numbers are selected using random-digit-dial methods. Landline respondents are chosen at random within each household on the basis of which member had the most recent birthday.
Samples are weighted to correct for unequal selection probability, nonresponse, and double coverage of landline and cell users in the two sampling frames. They are also weighted to match the national demographics of gender, age, race, Hispanic ethnicity, education, region, population density, and phone status (cellphone only/landline only/both, and cellphone mostly). Demographic weighting targets are based on the most recent Current Population Survey figures for the aged 18 and older U.S. population. Phone status targets are based on the most recent National Health Interview Survey. Population density targets are based on the most recent U.S. census. All reported margins of sampling error include the computed design effects for weighting.
In addition to sampling error, question wording and practical difficulties in conducting surveys can introduce error or bias into the findings of public opinion polls.
I pretty much posted this after several people said my comment that "the percentage of uninsured has dropped less than 2%" was BS. Well here you go folks. Even the highest group has dropped less than 3%. I expected more. Especially considering 83% of those who enrolled nationwide got financial assistance.
Good fact finding mission . It's important to be aware of how ineffective O'surance has been .
The crazy thing is when you say 1.2% the supporters say you are full of it but when you say APRX 3.5 million they rejoice. If you keep looking at the BIG picture here, The fact is that in a population of 313 million 3.5 million is disappointing. Even pitiful, when you take into consideration that 83% of the nationwide participants are getting federal aid in paying for the insurance. This tells me that 3.5 million now have health insurance who didn't but now APRX 221 million can no longer afford it. That's the problem.
Righties see the numbers as a percentage
Intelligent individuals see the numbers as
HUMAN BEINGS HAVING HEALTH INSURANCE FOR THE FIRST TIME
CHILDREN WHO NEED BONE MARROW TRANSPLANTS NOT BEING DENIED COVERAGE FOR HAVING A PRE-EXISTING CONDITION
WOMEN WITH BREAST CANCER NOT BEING THROWN OFF THEIR HEALTH INSURANCE BECAUSE THEY GOT SICK
A MAN WHO, PRIOR TO THE ACA, WOULD HAVE HAD HIS COVERAGE CANCELLED BECAUSE HIS HEALTH INSURANCE COVERAGE REACHED ITS CAP
WTF is wrong with you people?
Go ahead, piss on those reasons with some bullshit spin. Show us what you are.
BTW, the calculation is misleading; going from 17.1% uninsured to 15.9% uninsured is a nearly 10% decrease in uninsured Americans (Actual percentage = 9.3% decrease in the number of uninsured).
Wrong-headed. The comparison is not based on the entire population, it's based on the number of uninsured before the ACA and the number currently with the ACA.
Absolutely incorrect! If the number of uninsured Americans was 48 million before the ACA, how do we now have 221 million uninsured?
Must everything fit on a bumper sticker for Tea Party folks lest they be fooled by their own "leaders"?
REMINDER: The Number Of Uninsured Americans Increased by 7.9 Million Under George W. Bush
...
Nice diversion with a side of ad-hominem . When the program collapses as a failure where will your "humanitarian" perceptions perch next ?
If it succeeds, will your soul emerge?
How the fuck can anyone decry health insurance for human beings who previously had none?
My comments could only be ad hominem if directed at those showing some degree of humanity (ad hominem -- "to the man" or "to the person").
What kind of person can't understand the significance of
Expecting someone else to pay the tab for one's health insurance has a description : extortion .
BF or BW -- Mockery is what one uses when the facts are not on his side. That's the third time you have mocked me for correcting your misinformation! You can't learn in an echo chamber; the Tea Party Ministry of Propaganda is rendering you ill-informed.
The headline of this discussion is WRONG; it's either an attempt to intentionally mislead, or, the manifestation of a lack of understanding. But either way, it's WRONG!
The percentages reflect the NUMBER (the percentage of all Americans) UNINSURED BEFORE THE ACA AND THE NUMBER (the percentage of all Americans) UNINSURED after the initial implementation of the ACA!
Rounding off the numbers, 17% of Americans represents the number of uninsured Americans prior to ACA, or, about 48 million HUMAN BEINGS. The 15% represents the percentage of uninsured now since open enrollment for the ACA and Medicaid expansion.
With the 7.1 million Americans who have signed up for health insurance via the ACA, the 48 million in now closer to 40 million, and, with Medicaid expansion, the number of uninsured is closer to 38 million. Going from 48 million to 38 million is roughly an 8% EIGHT PERCENT DROP IN THE NUMBER OF UNINSURED AMERICAN HUMAN BEINGS (which for the benefit of Tea Party folks includes women, children, men, infants you know, people)!
Simply subtracting 15.3 from 17.1 is not how to calculate the percentage decrease in the number of uninsured. It is however another way to express the "I hope he fails" a-la-Rush Limbaugh stupidity for this country.
Hatred is a manifestation of willful blindness which in turn is a manifestation of willful ignorance. And it is hatred rather than fact that drives the insane, counter-productive and flatly wrong, endless assertions the right-wing makes about everything Obama!
The same sycophants who cheer the tax subsidies for oil companies, bullshit wars and the bail out of thieves on Wall Street, somehow resent helping their families, friends and neighbors get health insurance.
WTF is wrong with that picture?
Ummm ... are you forgetting anyone there in your declaration of the "brother's keeper" roots analysis? There are MANY atheist and humanist organizations with mission statements sharing the same principles. Don't worry, I'm sure it was a simple oversight on your part.
I fully agree with the commentary about how conservative concern for funding corporate welfare and government defense contracts is negligible in relation to their outrage over efforts to ensure the health of fellow human beings.
We Need Each Other To Survive, Believe it or not, we do need each other:
And WHY is it the government's responsibility to GIVE "human beings" insurance?
The corporations buy the legislators under the implied (or behind-the-scenes) condition of representing them over the 99%. It's one of the many abuses-of-power/conflicts-of-interests that call the tune in our government.
If the 99% get their asses out to vote, the 1% won't matter.
It's way overdue public elections no corporate, union or special interest money.
And WHY is it the government's responsibility to GIVE "human beings" insurance?
ANSWER(S):
Maybe for the same reasons that segments of the government bless the outsourcing of their jobs, thus taking away their health care, allow Wall Street to fuck over the economy and foreclose on their homes, steal their pensions, give the health insurance industry anti-trust exemptions, subsidize and allow corporations to go tax free even in the face of record profits, allow health insurance company CEO's (like United Health Care's) to make $50,000
AN HOUR and prior to the ACA, allowing 31 cents of every health insurance premium dollar to go to waste, CEO pay and stock options, and clerical departments whose functions were to find creative ways to deny claims and/or cancel policies when people got sick.
Other than that, I guess I don't know.
NOTE: I've already explained several times how the ACA will be sustained.
As for so-called "give aways," do you think that 200,000 veterans living homelessly with no health care (among other things) should be GIVEN something?
Take the path with a heart
ASIDE FROM WHICH -- THE HEADLINE OF THIS ARTICLE IS FACTUALLY INCORRECT AND EDITORIALLY DISHONEST.
Odd then that one of our greatest jurists agrees with me .
QUOTATION: The power to tax is the power to destroy.
ATTRIBUTION: This quotation comes from the words of DANIEL WEBSTER and those of JOHN MARSHALL in the Supreme Court case, McCulloch v. Maryland.
source :
Daniel Webster and John Marshall are not even tangentially related to this conversation.
But all right, let's go with John Marshall
Now, my QUOTATION:
"ASIDE FROM WHICH -- THE HEADLINE OF THIS ARTICLE IS FACTUALLY INCORRECT AND EDITORIALLY DISHONEST."
Petey,
You are among the first to complain about comments being "off-topic" albeit you usually deem anything "off topic" that represents an evolving conversation.
But OK, my comment is directly related to the topic -- from the headline on down. And you being likely the most mathematically-adept on NT, how about you acknowledge the veracity of my comment?
Intelligent people look at all aspects of the picture. There is more than one way to skin a cat. Just because someone doesn't think this program is sustainable doesn't necessarily mean they don't want people who need insurance to have it.
True; and when they make fundamentally flawed assertions and then compound those flaws by making editorial conclusions based upon them, if they fail to acknowledge those phenomena, they are deemed either "less than intelligent" and/or disingenuous.
You posted a headline that is both an incorrect calculation and a conclusion based on its false premise. And now you want to play with words. If you believe the ACA is unsustainable, basing that belief on a pair of mutually-dependent falsehoods is not the way to do it.
How about you admit your errors then try to make your case based on facts (which BTW have yet to be determined). You guys are so determined to make Obama look bad that you run with every bullshit assertion fed to you.
Fast and Furious, Benghazi, birther and death panel bullshit, the IRS "scandal" -- ALL FALSE!
You not only haven't looked at ALL aspects of the picture, YOU POSTED A BOGUS PICTURE and when it was revealed as such you did not have the credibility to acknowledge it!
Let's have discussions not false assertions cheered on by a circle jerk contingent.
As long as you're skinning cats, you might consider skinning the right ones.
AMAC
you did point out a mistake in my calculation, I should have calculated from the number ENROLLED (BTW #enrolled is not really the same as #insured but I will save that debate for another time)
so 15.9% of 313 million is 49,767,000 so I should have started my calculation from 263,233,000 as this is the number insured. (313 mil minus 49,767,000)
Look closely I did not say 212 million were uninsured, I said 212 million can't afford it,I got this number by multiplying 313 million by 83% (the % of people getting financial assistance) I admit this is flawed, I should have used the number ENROLLED * 83% so in reality only 218,483,390 can no longer AFFORD insurance on their own, somehow 218.5 million who can't afford insurance doesn't make me feel much better than 212 million who can't afford it.
It still does not make sense. The number of uninsured prior to the ACA was roughly 48.6 million. Your 313 million represents the entire population; Presumably, those not among the 48 million are insured which means they buy (can afford) insurance or they and their family members get it via their employment. 313 million - 48.6 million = 264 million NOT AMONG THE UNINSURED, thus a.k.a. "INSURED".
And going back to your headline which wrongly claims only a 2% decline in the uninsured, the actual decline of around 8% makes the ACA 400% greater that your editorial comment implies!
I actually did admit my error, I also pointed out your error in interpreting people who can't afford insurance on their own as uninsured:
AMAC
you did point out a mistake in my calculation, I should have calculated from the number ENROLLED (BTW #enrolled is not really the same as #insured but I will save that debate for another time)
so 15.9% of 313 million is 49,767,000 so I should have started my calculation from 263,233,000 as this is the number insured. (313 mil minus 49,767,000)
Look closely I did not say 212 million were uninsured, I said 212 million can't afford it,I got this number by multiplying 313 million by 83% (the % of people getting financial assistance) I admit this is flawed, I should have used the number ENROLLED * 83% so in reality only 218,483,390 can no longer AFFORD insurance on their own, somehow 218.5 million who can't afford insurance doesn't make me feel much better than 212 million who can't afford it.
313,000,000 * 15.9%(the % of those uninsured)=49,767,000.....313,000,000 -49,767,000=263,233,000 ENROLLED people, 263,233,0008 x 83% (the percentage of ENROLLED people getting financial assistance)= 218,483,390 people who CAN"T AFFORD INSURANCE ON THEIR OWN. Please point out the error in my calculations.
313,000,000 * 15.9%(the % of those uninsured)=49,767,000.....313,000,000 -49,767,000=263,233,000 ENROLLED people, 263,233,0008 x 83% (the percentage of ENROLLED people getting financial assistance)= 218,483,390 people who CAN"T AFFORD INSURANCE ON THEIR OWN. Please point out the error in my calculations.
Rounding off the numbers,
48 million out of 313 million represents approximately 15% of the population -- the percentage of uninsured Americans prior to the ACA.
Since the ACA, 7.1 million have signed up and another 3 million have gotten insurance via Medicaid expansion.
48 million - 10 million = 38 million out of 313 currently uninsured (many of whom require assistance with health insurance premiums)
313 million - 38 million = 275 million who have obtained insurance either by paying premiums or, via their employers (spouse's employer, parents' employer). One way or the other, they can afford or recieve health insurance without government assistance.
Those you identify as "ENROLLED" -- 263,233,008 are not receiving health insurance via ACA enrollment or Medicaid! They obtain it as I indicated.
I assumed he meant "can't afford health insurance for themselves and family members" (where they would apply). Either way, his calculations are not applicable based on what I have explained).
Do people enrolled in ACA have to provide insurance for their children? The bottom line is 83% of those enrolled are getting financial help and that means if they have kids and they must insure their children under the ACA program, and they are getting help to be able to afford it for their family, then the numbers are not really far off. If the child's parents can't afford it they would also fall into the group of those who can't afford it, wouldn't they? Are you trying to say that all the children should not be counted weather they are getting assistance or not? Seeing as they still exist, they have to be accounted for, suggesting they can be omitted from the numbers of subsidized health care is ridiculous, even for you. Do you think the administration has left children out of the figures of "number of insured Americans"? I don't think so.
You are just plain wrong!
The 48.6 million included children and spouses, ALL UNINSURED HUMAN BEINGS IN AMERICA. Even if 100% of those enrolled under ACA were getting assistance, it has still reduced the number of uninsured by 8% since before the ACA NOT YOU 2% number.
400% more effective than your headline makes it out to be.
Even for me?
Pretty cocky for someone who clearly has either misrepresented or misunderstood from the headline on down and still doesn't understand the flaws in his own conclusion.
But your cheerleaders will still likely come along and back you up or muddy the waters with red herrings.
I'm sorry I can't make you understand what I've clearly broken down for you.
If you don't think so -- you're correct; children are included among the uninsured and INCLUDED WITHIN THE 48.6 million, and now, the 38.6 million.
I guess they can't afford to buy the insurance without assistance
I mean many of them being like, I don't know say six years old.
And because the ACA allows parents who purchase insurance on their own to keep children (up to age 26) on their policies, that keeps down the number of insured individuals needing assistance.
OK I see what you are saying. not all of the people who currently have insurance are getting it from ACA and/or medicaid.
...
going by the number ENROLLED IN ACA (as of March 1) the number the government is giving us is 4,242,000 and 83% of that is 3,520,860 add the uptick in medicaid
62 million plus 3.5 million is 65.5 million or a mere 21% of the population that can't afford/don't pay their health insurance on their own. Or roughly 25.3% of those currently insured can't afford do pay for it on their own. I stand corrected. Still almost 1/4 of the population can't afford it.
A Mac
Is it not reasonable to assume that not all of the 7.1 million who signed up for the ACA were previously uninsured, since so many insured people lost their policies and signed up and some signed up for a better deal than they had before even though they were insured.
I am late to the party and if this has already been asked and answered my apologies.
Upon losing their (junk) policies, they became among the uninsured and in reality, having junk policies is the equivalent of being uninsured. And I believe many of those junk policies are currently grandfathered so their holders are not among the 10 million.
I don't know how many among the 10 million had policies from which they were dropped or, from which the switched. It's a reasonable point to raise but my guess is (and I'll research it) that the overwhelming majority of the 10 million were long-term or perennially uninsured.
FYI: Grandfathered plans are plans that were purchased before March 23, 2010. These plans have a grandfathered status and don't have to follow ACA rules and regulations or offer the same benefits, rights and protections as new plans.
RIO, I'll concede this; in the absence of a national data base, all the numbers on all sides -- may be inaccurate.
One further point; if people are dropping junk polices for options under the ACA, remember, it's not "Obamacare," it's the AFFORDABLE Care Act.
Fair enough?
OK so do you agree with my calculation that aprx 1/4 are getting assistance as calculated by those receiving assistance under ACA and those on medicaid?
Sure they are . O'surance is a tax . Taken to extremes taxes can destroy . Simple . Thanks for playing .
I was talking to John when I said "even for you" BTW
I should have calculated from the figure of those insured, I admitted this and corrected it previously
...
going by the number ENROLLED IN ACA (as of March 1) the number the government is giving us is 4,242,000 and 83% of that is 3,520,860 add the uptick in medicaid
62 million plus 3.5 million is 65.5 million or a mere 21% of the population that can't afford/don't pay their health insurance on their own. Or roughly 25.3% of those currently insured can't afford do pay for it on their own. I stand corrected. Still almost 1/4 of the population can't afford it.
As far as trying to bring children into the calculation, there is no way to determine that number, so by that logic any claim made by anyone including the administration on numbers is a bullshit estimate
Wrong. If the ONLY individuals tallied were the ones signing up for insurance, then logically the numbers actually becoming insured would be even greater because, children and spouses would not appear in the tallies but would still be among the insured under the ACA!
If for example, a husband signs up for himself, his wife and his three kids, the SMALLEST NUMBER ADDED TO THE TALLY WOULD BE 1 (ONE) -- BUT THE ACTUAL NUMBER, SHOWING OR NOT IN THE TALLY would be 5 (FIVE). By your own reasoning 96WS6, if your scenario is the actual scenario, 10 million would be the lowest possible number of insured! THE LOWEST!
If the administration's numbers UNDER YOUR SCENARIO ARE "BULLSHIT" it's not because they're overstated, rather, it's because they'd be understated!
YOUR scenario.
You are talking about the total number of insured and I am talking about the number that need to be subsidized. So in that scenario my number is still the lowest. If one buys subsidized insurance for a family (to take your example) not 1 (one) but 5 (five) would be subsidized. It works both ways.
Also, I wanted to ask if your number of people who signed up includes those who lost their "junk" insurance? Now you can argue they have better insurance now but you can't count them as people who didn't have insurance that now do. So if you subtract the number of people who lost their insurance from the number of...what was it 7.1 million who signed up I believe I read? What is the number of people who got insurance that didn't have any before?
Those whose junk policies were cancelled became uninsured.
None of this sidebar stuff is relevant however. What's relevant is the PERCENTAGES YOU PROVIDED IN YOUR HEADLINE AND THE WAY YOUR INCORRECT CALCULATIONS INCORRECTLY ADDED UP TO JUST A "WHOPPING 1.2%"!
YOUR NUMBERS YOURS!
YOUR NUMBERS represent NOT a 1.2% decrease in the uninsured, but 4 TIMES that decrease. Let's not change the issue.
However the 10 million got to be among the ACA sign ups is not the issue; the issue is, when the smoke clears, America went from 17% uninsured to 15% uninsured, that BECAUSE OF THE ACA -- an 8% decrease, 400% better than a 1.2% decrease.
I'm finished in this thread.
The article says 1.2% DECREASE in the number of UNINSURED implying more people are insured. ( a 1.2% increase of the number insured) I never claimed less people are insured than before ACA. I AM trying to convey the number of NEW insured is deceiving.
I've always loved math. The figures above aren't bad. They are only off by a couple of percent.
17.1-15.9 = 1.2 decrease
1.2/17.1 = 7.017544% decrease in uninsured not 9.3%
It really doesn't matter anyway. The graphs and information above are only an estimate originating from phone calls and contains no concrete evidence of anything.
If you were to tell me there are 313,000,000 citizens in the USA and 46,000,000 of them are without insurance, then I would say 267,000,000 of them do have insurance.
If you were to tell me now there are still 313,000,000 citizens in the USA and now only 38,000,00 of them are without insurance, I would say 275,000,000 now have insurance.
And that is 8,000,000 more citizens now have insurance than before.
So...
275 million - 267 million = 8 million
8 million / 267 million = there has been a 2.996255% increase in the number of people with insurance.
Now if you look at the graph...
You will notice 2008 started out with 14.6% uninsured.
By the end of 2008 there were 15.4% uninsured. (5.479% increase of uninsured)
By the end of 2009 there were 16.4% uninsured. (6.493% increase of uninsured)
By the end of 2010 there were 16.6% uninsured. (1.219% increase of uninsured)
By the end of 2011 there were 17.5% uninsured. (5.421% increase of uninsured)
By the end of 2012 there were 16.3% uninsured. (6.857% decrease of uninsured)
By the end of 2013 there were 16.5% uninsured because the green line crosses the end of the quarter between 16% and 17%. (1.226% increase of uninsured)
Now someone says we have 15.1% uninsured, I assume by the end of March 2014.
So as you can see the number of uninsured citizens grew from the end of 2008 and has never gone below the number of uninsured the last day of 2008, but has at times gone from 14.6% (last day of 2008) all the way up to 18% during the last quarter of 2013 which was a 23% increase from the last day of 2008 until I assume the enrollment period started.
This is a brilliant tactic to use at this time on the dumb down public. As you can see the number of uninsured kept going up all during the first term of Obama and during this last year. Nothing has gotten better to improve it until Obamacare started enrolling people with 83% of them getting subsidies. It's an enrollment of the citizens into the mindset of a welfare state and I bet anyone who disagrees with me will not be impacted at all by this, meaning they aren't having to pay more because of it and could be paying less or nothing now.
This solves one problem for Obama. Now it can be used to show how good things are, but it is a false flag.
What we really need to know is the cost of the subsidies and we know it doesn't affect the elites one way or the other, but the middle income, individuals not being subsidized making $46,000 or more are paying for the subsidies.
The individual making $150,000 a year isn't paying any more of it than the individual making $46,000 although the individual making $150,000 is paying more Federal and state taxes unless the money earned is money that has already been taxed and they are receiving it in the form of interest or dividends from long term investments.
It doesn't matter if a person has $500,000 worth of property, $500,000 in the bank or rent, have nothing and they are 63 for example, if they are making $20,000 a year and choose the Bronze Plan it is free. Or if they go with the Silver (most pushed) policy it is less than $100 month.
Now the unsubsidized premium to the person making $46,000 for the silver plan under these same circumstances is $760 per month.
Now is has started coming down. Could it be some of those people who lost their insurance because of Obama's unconstitutional actions of changing the law of the land which isn't an Executive Power are among those who didn't have insurance when they signed up for Obamacare? Of course it could. Also the increase in people without insurance could have been from all the policies cancelled because of Obamacare.
Now folks this decrease in the number of citizens looking back at the last 5 years indicates it started out with 14.6% at the end of 2008 without insurance and went all the way up to 18% without insurance.
I'm sure once people who did or did not have insurance realized they could get insurance for free, they started enrolling a lot more. But that is the objective, motivate the people down to the lowest common denominator.
Actually, since the enrollment time started until the end of March the number of citizens without insurance has come down from that 18% to 15.1%. And that is a 16.1% decrease.
This is the way it works. The less people who are without insurance the more effect a 1% decrease or increase has.
For example if you have 5% of the citizens who don't have insurance, then a 1% decrease to 4% would be a 20% reduction in the number of people who are without insurance.
And in saying that if you have 50% of the citizens who do not have insurance, then a 1% decrease to 49% would be a 2% reduction in the number of people who do not have insurance. I used an exaggerated number to emphasize my point.
Obama's idea of coverage for all is the same idea a drug pusher on the corner has to get everyone he can addicted to heroin.
Neither of you have it absolutely correct. It really doesn't matter how many people are involved in these calculations. If 17.1% did not have insurance and now only 15.9% do not have insurance it is a 7.017544% decrease in the number of people who did not have insurance plain and simple.
Let me put this up one more time. I noticed you didn't understand it the other day, but I didn't inform you, but if you use the calculator maybe it will inform you so you will know more about the product.
Just enter the informaton requested and it will give you the premiums.
Just enter your state.
Your zip code.
$46,000 income.
No employment coverage.
1 person in the family who is making that $46,000.
#6 = 1 adult.
Age 63 non tobacco user.
And finally no children.
Tell me what you come out for a premium. You will not see it come out to $400 a month.
Kaiser calculator to figure premium..
[0][age]=21&adults[0][tobacco]=0
Also the unemployment rate has come down more due to the fact people going on disability which provides insurance is the main reason. Getting out of the work force and going on disability.
More people going on disability than getting jobs under Obama
By: John Hayward
Investors Business Daily offers an amazing snapshot of the Obama malaise: More workers joined the federal governments disability program in June than got new jobs, according to two new government reports, a clear indicator of how bleak the nations jobs picture is after three full years of economic recovery. The economy created just 80,000 jobs in June, the Bureau of Labor Statistics reported Friday. But that same month, 85,000 workers left the workforce entirely to enroll in the Social Security Disability Insurance program, according to the Social Security Administration.7/6/2012 12:56 PM
And this is not a new piece of bad news for June 2012: The disability ranks have outpaced job growth throughout President Obamas economic recovery. While the economy has created 2.6 million jobs since June 2009, fully 3.1 million workers signed up for disability benefits. In other words, the number of new disability enrollees has climbed 19% faster than the number of new jobs created during the sluggish recovery.
Rising disability claims are, in part, a consequence of Obamas endless unemployment, as experts say that more people try to get on disability when jobs are scarce.
How scarce are they? IBD notes that the total number of people whove dropped out of the labor force entirely has exploded, climbing 7.3 million since June 2009. Weve got 5.4 million long-term unemployed, which is almost one million higher than when the recovery began three years ago, and almost twice the level it ever reached prior to Obamas recovery.
Welcome to our fully disabled future of barely-managed decline!
...
And in spite of all of this the uninsured increased nearly every quarter since Obama has been president. You have the media and the CBO on your side. It's tough getting the truth out there with all the obstacles working to prevent the truth from shining through.
96.... that 17.1% to 15.9% is just the percent of change.
If you look at it like this:
100% - 71.1% = means 82.9 percent have insurance.
100% - 15.9% - means 84.1% now have insurance.
So we have gone from 82.9% of the people to 84.1% of the people now have insurance. So we ask, what is the percent of change of people who now have insurance?
82.9% increasing to 84.1% of the people now having insurance.
82.9% - 84.1% = is an increase of 1.2% so what is the percentage of change?
1.2%/82.9% = We have increased the percentage of change in the number of people who now have insurance by 1.447527%
This is the proper way to look at it.
Also the success of anything can depend on the way it is perceived. The typical way to show the evidence is to make it appear the way you want it to look the best.
The real facts are not what percentage of change in reducing the number of uninsured, but the percentage increase in the number of people that now have insurance based on the total being a perfect 100% covered and what percentage we now have insured since Obamacare came into the picture.
You will find it to be much lower than they would like you to understand.
This is based on all information we only have 1.45% more people insured than we did based on having 100% covered as ideal when the enrollment started and 83% of that increase are receiving it with either a subsidy or free. And that was when the uninsured was the highest it has been since the end of 2008 which was only 14.6% and it was 18% when the enrollment started, so you can see only a very small percentage has insurance now than did before Obamacare. Only 1.44727% change in the number of people are now insured. 82.9% had insurance before and now 84.1% have insurance. The percent of change has been 1.2% divided by 82.9% is 1.447527%.
How Well Is Obamacare Covering The Uninsured? A Glass Half EmptyMoment
The enrollment period for Obamacare Exchange sign-ups has officially endedunless, of course, you are one of many given a reprieve in the last furious round of unilateral (arguably illegal) administrative changes to the law (as fellow Forbes contributor Scott Gottlieb has pointed out, ObamaCare enrollment never truly closes ). The LA Times , relying heavily on as-yet-unpublished RAND Corporation survey figures, has reported a grand total of 9.5 million formerly uninsured have gained coverage. How should we assess this figure? Is that a success, failure, or something in between? Heres how to interpret that number or any other similar number you hear in the days, weeks or even months ahead.
Hard Truth #1: The Total Number of Uninsured Has NOT Declined by 9.5 Million
The LA Times figure includes 2 million uninsured purportedly covered through the Exchanges, 3 million previously uninsured young adults purportedly covered under their parents policies and 4.5 million covered through Medicaid.
Roughly 1 Million With Cancelled Plans Remain Uninsured . The problem with the first figure is that the LA Times itself reports Fewer than a million people who had health plans in 2013 are now uninsured because their plans were canceled for not meeting new standards set by the law, the Rand survey indicates. [1] This means we have to subtract this ~1 million newly uninsured group from the 9.5 million to arrive at the net reduction in uninsured of 8.5 million.
The Number of Previously Uninsured Young Adults Covered by Parents Half as Large as Reported . It was announced nearly 2 years ago that 3.1 million previously uninsured young adults age 19-25 had gained coverage as a consequence of the Obamacare mandate that parental plans cover such dependent children. This was based on an analysis of data from the National Health Interview Survey. However, theres two other much larger surveys that both show much smaller declines: 1.8 million according tothe American Community Survey (ACS) [2] and 1.4 million using the Current Population Survey (CPS). [3] Im willing to split the difference and say that this feature of Obamacare reduced the number ofuninsuredyoung adults by 1.6 million, meaning the net reduction in uninsured across the entire population is 7.1 million.
Hard Truth #2: Performance is Well Below CBO Projections
So is 7.1 million fewer uninsured a job well done or something in need of drastic improvement? The non-partisan Congressional Budget Office has been the official scorekeeper for Obamacare since well before it was even passed. I see no reason not to use CBO projections of coverage as the basis for determining how well the law is doing at this juncture. Indeed, using CBO projections arguably will make the law look far better than it would otherwise, since CBO has rather drastically scaled back its expectations for the law since 2010. CBOs estimates of the number of uninsured we might have expected to see in 2014 absent the law have fluctuated over time. So the fairest comparison is to measure performance against the projected percentage reduction in the total number of uninsured who we would have in 2014 were the law not enacted.
[Note: original version of this chart showed 59.3% for March 2010. See Update #2]
When CBO originally scored the law, analysts expected it to have reduced the number of uninsured by nearly two-fifths by 2014 alone (all estimates shown are calculated by comparing CBOs projection of the reduction in the number of uninsured under the law to its projection of the number of uninsured in 2014 without the law). [4] Within a single year (well before anyone had a clear idea of how many states would set up their own Exchanges or expand Medicaid) CBO analysts had dialed down that prediction to under 40%. By the next year it had shrunk nearly one-fifth more. Then, in the aftermath of the June 2012 Supreme Court ruling which made Medicaid expansion optional for states rather than virtually mandatory, it lowered its prediction to one quarter of the uninsured having gained coverage by 2014. Today that figure is under 23% and it remains to be seen whether CBO will adjust its expectations even further given that the actual reduction so far this year is only 12.5%.
Clearly, that figure will increase slightly as those given a reprieve from the March 31 deadline finally end up enrolled in plans. Offsetting this, however, will be the expected attrition in enrollments as people fail to keep paying their premiums.In early March 2014, health insurance industry expert Bob Laszewskireported that carriers are telling me that another 2% to 5% of those January enrollments never paid their second month... . This obviously is a little concerning since one would have expected the first batch of enrollees to be the sickest, most in need of coverage. In contrast, the evidently less motivated laggards who signed up in March might be expected to display an even high attrition rate as the year goes by, especially if they observe they are not getting even close to using up their deductible and feel that continuing to pay premiums is just throwing good money after bad (Im not arguing this is a sensible way to view health coverage, but many Americans do).
Thus it remains to be seen whether 2-5% attrition due to non-payment persists month after month or was an unusual fluke during a much harsher than average winter that may well have stressed households more than expected. The point is that theres no a priori reason to expect that the net 7.1 million reduction in uninsured will increase in size as 2014 continues since any modest growth in coverage may well be entirely offset by attrition.
Likely Truth #3: Had CBO Projections Been Accurate, Obamacare Never Would Have Passed
I hope I have provided a useful way of assessing where we are on expanded coverage in this first year of major coverage expansion. At the end of the day, we appear to have covered 1 in 8 uninsured, but to get to this point, we have disrupted coverage for millions, increased premiums for tens of millions more and amplified the pain even further with a blizzard of new taxes and fees that will end up cost even the lowest income families nearly $7,000 over a decade .
Nothing I have seen in the rollout to date has altered my earlier estimate that well see at least 4 losers for every winner under Obamacare, especially given that nearly two thirds(4.5 million of the 7.1 million) of the newly insured have gained their coverage through Medicaid rather than private coverage. Few would argue its bad news to see 7.1 million Americans gain coverage, but its regrettable that such a vastly bigger number of the nations citizens had to experience the dislocations, anxiety or greater financial burdens that they did since that really wasnt necessary had Obamacare been designed more sensibly.
Moreover, imagine a world in which on March 20, 2010 the CBO had provided an accurate projection of exactly how the law actually would play out:
You get the idea. Armed with accurate information about its actual effects, what member of Congress would have voted for this lemon law ?
Update #1: April 1
Someone pointed out I hadnt accounted for how many have paid for their Exchange coverage. This assuredly is an issue, but its also murky. Remember that my 7.1 million uninsured figure only includes 2 million enrolled through the Exchanges. The conventional wisdom is that about 20% havent yet paid for their Exchange coverage but such estimates dont distinguish between previously uninsured enrollees and those with prior coverage (see here for details). The latest McKinsey survey (conducted in February, reported in mid-March) shows that only 53% of the uninsured have paid for their coverage (vs. 89% for those with prior coverage), so hypothetically, I could deduct up to 940,000 uninsured non-payers from my count.
However, others have pointed out that many people wait until the last minute to pay bills and the mere fact that people had not yet paid was not a certain indicator that they would not etc. Charles Gaba provides a thorough discussion of the nuances entailed in interpreting these figures. Moreover, the historical unpaid rate in the non-group market was 10% and experts such as Avalere president Dan Mendelson speculate that over the long run, the unpaid rate will turn out to be 5-10%. In short, the numbers are all over the map. In the worst case (47% nonpayment), it knocks 940,000 off my 7.1 million figure. In the best case (5% nonpayment), it knocks off 100,000. Given that we surely we see additional incremental gains in reported Exchange coverage as those given a reprieve complete their applications by mid-April, along with on-going reductions in the uninsured through the balance of the year due to Medicaid enrollments, it did not seem worth putting a figure that subject to dispute into my analysis. I think it will largely be a wash with unpaid losses offset by enrollment, but readers can decide for themselves. And it does not materially affect the bottom line: whether were somewhat below or somewhat above a glass half empty is not likely to greatly alter the publics perception of how to assess this laws performance.
Update #2: April 1
H/T to Larry Levitt atKaiser Family Foundation for spotting an error in my original chart: In the March 2010 CBO projection Id inadvertently plugged in the figure for 2019 (59.3%) instead of the correct figure for 2014 (37.3%). My apologies for this mistake and thanks again to diligent readers such as Mr. Levitt who bring such matters to my attention.
Update #3: April 2
Glenn Kessler at Washington Post has done some further digging into the RAND numbers. Of particular importance is what he found out about the Medicaid figure reported by LA Times: As of March 22, the survey found that the percentage of Americans on Medicaid had increased from 7.7 percent in 2013 to 10 percent in 2014; with the surveys margin of error of 2 percentage points , the percentage of Medicaid recipients in 2014 could be anywhere between 8 and 12 percent. Carmen said the Times calculated that the 2.3 percent increase would translate into 4.5 million people, but thats not RANDs calculation. With the margin of error, the numbers could swing dramatically. As an economist, Carmen said, she felt more comfortable sticking to just percentages.
This raises two issues. First, not every new Medicaid enrollee would have been previously uninsured. RANDs survey doesnt answer this question, but RANDs COMPARE microsimulation model shows that of 13.1 million net new Medicaid enrollees in 2016 (above and beyond what number would have been in Medicaid absent Obamacare), 10.8 million (82%) would be coming from the ranks of the previously uninsured ( Table 1 ). So if 82% of the estimated 4.5 million added to Medicaid are uninsured, the net reduction in uninsured ranks would be 3.7 million, reducing my 7.1 million figure to 6.3 million.
Theres also the what would have happened otherwise issue. That is, Medicaid enrollments as a share of the non-elderly population have been rising slowly and steadily since at least 2008 (interested readers can generate their own trend chart here ). So at least some of the observed increase in Medicaid coverage presumably would have occurred anyway (17.8% in 2012 vs. 16.9% in 2010, according to the American Community Survey, i.e., a 5.3% increase in chances of being on Medicaid; without seeing the RAND survey I have no idea why their estimates of Medicaid coverage are so much lower than ACS). Given that the economy was improving (albeit weakly) between 2010 and 2012, its hard to attribute the increase to adverse economic trends. So one could argue that the Medicaid penetration rate would have increased another 5.3% by 2014, in which case we can shrink the 4.5 million by another 240,000, which gets my figure down to about 6.1 million or 47% of the CBO projection. Thus, the net reduction in uninsured attributable to Medicaid is under 3.5 million (a figure quite similar to Jim Caprettas assessment today at National Review: The number of people now on Medicaid who would otherwise have been uninsured is likely around 3 million or so at this point.) If my adjusted figures are correct, we are just below instead of just above a glass half empty moment.
Kessler also notes something I didnt focus on which is that even if we take 4.5 million new Medicaid recipients at face value, that is far below (44%) the 8 million figure projected by CBO ( Table B-2 ) in its February 2014 budget estimates. So we are at a glass half empty moment both in terms of Medicaid enrollments and in terms of reducing the number of uninsured. Admittedly, Medicaid enrollment is year-round, so these figures may rise by the end of 2014, so it remains to be seen where we end up.
Update #4: April 3
Today, Avik Roy has done a terrific deep dive into the 19-25 data, pointing out that if compares the experience of 18-24 year olds to their counterparts 25-34 (that just happens to be how the data are sliced) between 2008 (a pre-recession look) and 2012, a case can be made that only 931,000 young adults have gained coverage as a consequence of Obamacare, not 3.1 million (as one cherry-picked set of NHIS results shows), or 2.2 million (as another set of NHIS results shows, according to Washington Posts fact-checker, Glenn Kessler), or 1.8 million (ACS) or 1.4 million (CPS). Since I averaged the latter 2 figures, Aviks number implies that 700,000 should be subtracted from my revised estimate of 6.1 million. Thats a net reduction of 5.4 million uninsured (i.e., 9.5% of CBOs projected 2014 figure of 57 million uninsured absent Obamacare).
Footnotes
[1] As a proud graduate of the Pardee RAND Graduate School , its always been a pet peeve of mine to see RAND Corporation mislabeled as Rand Corporation. I would think that of all the papers in the country, LA Times ought to be least likely to get this wrong. End of rant.
[2] Using the ACS, the point-in-time estimate of the number of uninsured young adults age 19-25 declined from 9,541,264 in 2010 to 8,017,137 in 2012 a net decline of 1.5 million that is only half as large as the figure obtained from NHIS (if measured from 2009, the decline is larger by only 30,000 people). Uninsured risk declined from 31.8% in 2010 to 26.0% in 2012 (margin of error=0.3 for both years). If the reduction in uninsured risk is applied to the 2012 population of young adults, it implies that there were1,820,146fewer uninsured young adults as a consequence of this reduction in risk.The ACS is a much bigger survey than NHIS, covering 3.5 million people each year; hence the NHIS sampling error is 3.5 times as large as ACS .This larger sample size generally makes it superior for more accurately calculating changes in coverage over time, especially for fine-grained age sub-categories such as young adults.
[3] Using SHADAC-enhanced CPS figures (thought to be more accurate), the estimate of the number of all-year uninsured young adults age 19-25 declined from 9,421,442 in 2009 to8,361,983 in 2012a net decline of 1.1 million. Uninsured risk declined from 32.2% to 27.7% during that period (margin of error 0.9% in both years). However, if the reduction in uninsured risk is applied to the 2012 population of young adults, it implies that there were1,412,238 fewer uninsured young adults as a consequence of this reduction in risk. Though not as large as the ACS, the CPS also is a much bigger survey than NHIS (hence the NHIS sampling error is 1.75 times as large as CPS ), though it has a longer recall period and responses are imputed for about 10% of CPS respondents (versus almost no imputation for NHIS). Despite these limitations, it is the standard source of the widely reported figure of 48 million uninsured andits larger sample size provides some of the same advantages as ACS in terms of accurately calculating changes in coverage over time for narrow age groups.
[4] Those wishing to check my work can find here all links to all the CBO tables used to calculate the figures in the chart.
...
What gets me is the CBO's moving target in its estimates!
I don't expect too many to challenge these calculations because they are factual. But I do expect as some would say a twist or two to try and discredit this informaton because they are the same people who can't seem to remember all the lies we've all been told.
You can keep your insurance.
(Reality millions of Americans have lost their coverage and millions more will lose their coverage)
You will be able to keep your doctor.
(Reality many Americans may not be able to keep their present doctor and if they can may have to pay extra?
You're typical family premium will be reduced by $2,500.
(Reality many Americans have found their insurance now cost significantly more due to Obamacare)
For the 85 and 90 percent of Americans who already have health insurance, this thing's already happened. And their only impact is that their insurance is stronger, better and more secure than it was before. That's it. They don't have to worry about anything. (like hours being cut back and companies dropping insurance. I put this in)
(Reality Obamacare imposes certain new benefit mandates on those with employer-sponsored coverage-a majority of Americans)
Under my plan no one making less than $250,000 a year will see any form of tax increase.
(Reality Obamacare contains 10 separate tax hikes, fees and penalties, many of which heavily impact the middle class)
I will not sign a plan that adds one dime to our deficits- either now or in the future.
Reality Obamacare's new spending is unsustainable.
Whatever ideas exist in terms of bending the cost curve and starting to reduce costs for families, business, and government, those element are in this bill.
(Reality Health spending is still rising and is projected to grow at an average of at least 5.8 percent from 2012 to 2022 and that is today's projection which always seems to change and not for the best and Obamacare doesn't even address cost.)
I will protect Medicare.
(Reality Obamacare cuts Medicare spending) In fact...
Obamacare makes unprecedented and unrealistic payment reductions to Medicare providers and Medicare Advantage plans in order to finance the new spending in the law. The cuts amount to over $700 billion from 2013 to 2022. If Congress allows these draconian reductions to take place, it will significantly impact seniors ability to access care.
I will sign a universal health care bill into law by the end of my first term as president that will cover every American.
(Reality Millions of Americans will remain uninsured)
So this law means more chioces, more competition, lower costs for millions of Americans.
(Reality Obamacare has not increased insurer competition or consumer choice.)
I sold individual and group insurance for more than a dozen years and I never sold a policy as bad as the Silver Plan, which is the one they're pushing the most in all that time.
Sorry John, but I'm not wrong in what I'm saying regardless of the headline. There have been only 1.45% percentage of change in the number of insures.
I understand how the two of you are looking at it, but the simple fact is how many more people have insurance relative to how many had insurance before.
You're trying to show how many didn't have insurance before and how many more have insurance now.
There's a difference in this.
I'm showing the percentage who had insurance and then the percentage who had insurance when the number changed from 82.9% of Americans had insurance and after the change in percentage became 84.1% had insurance and the change is....
82.9% - 84.1% is equal to a 1.2% change in percentages. That is a 1.447527% change from 82.9% to 84.1% in the number of people who had obtained insurance.
I'm not worried about anyone else signing up. I'm completely aware of the ones who had insurance and were able to maintain it wouldn't have to sign up.
I'm not using the headline. I'm only using the percentage of uninsured (17.1%) before and the percentage of uninsured after it became (15.9%.)
Sure it sounds good the way you and A Mac have stated it, but it is much more truthful if you look at the percentage of people insured before and then the percentage of people insured after the Obamacare enrollment started. These people would have been included in the percentage insured before and the additional people would make that total a larger percentage, which it did.
Like I said the number of people uninsured or insured makes no difference. It's the change in percentage only. And going from 17.1% to 15.9% is a 1.2% change. And the percent of change is 7%, not 9.3% as A Mac stated. The percentage of people insured is always 100% minus the the percentage of people who are not insured no matter how many there are.
And if 100%-17.1% is 82.9% who had insurance before the change
and...
percentage of uninsured was reduced by 1.2%
Then 100%-15.9% became 84.1% now had insurance.
The percentage of change in the number of people who now had insurance became 1.2% divided by the original 82.9% is 1.45% percentage of change of people who now had insurance.
Doesn't look that good that way does it? It's all in the way it is presented.
It's basically the same thing you and A Mac are saying except A Mac's 9.3% is incorrect, but it's a more realistic way of looking at it as to what the effect of the percent of change really means in the objective of obtaining coverage for everyone.
John is it not true that 17.1% of the people didn't have insurance?
That being true then 82.9% had insurance.
Isn't it true that percentage came down from 17.1% to 15.9% who didn't have insurance?
That being true the new percentage of people who had insurance became 84.1%.
The change in percentage was 1.2%. Isn't that true?
That being true means 1.2% divided by 82.9% is .01447527 or rounded to 1.45% percentage of change.
To make it easy for you I have found a "Percent of Change" calculator for you to use.
----------------------------------------------------------
Check the percent of change from 17.1% to 15.9%.
And check the percent of change of 82.9% to 84.1%
Use this calculator.
A Mac
Agree 100%
There are arguments to be made for and against the PPACA, its implementation and the short and long term effects it will produce but mostly what people shout about are how many lost their policies and how many are newly insured and how many are paying more and how many are paying less and to your point no one really has an accurate handle on any of those numbers.
I see the PPACA as the law, a small step towards reforming health care and hopefully not the last step. Whathealth carewill look like two years, five years or ten years from now is something that we will have to wait for, hoping for the best and preparing for the reality of a rocky road to change
Again appreciate the feedback and the answer to my question
According to the 2010 Census, there were 308, 745, 538 people in the United States
Population Clock: 4/5/2014
317,813.271 Population in the United States and Counting:
There has been an increase in population from = 308,745,538 1n 2010 to 317,813,271 as at 4/5/2014 = 9,067,733 this is an increase in population growth, I am sure this number includes Births, Death, Immigration and everything that goes into figuring the population of a country, that does not change the number of people now having health insurance, it changes the percentage of the population, but not the numbers now been enrolled into health insurance...And, I am specifically speaking about Obamacare, not other Insurance such as Employment, VA, Medicare or other entities that is not part of the Obamacare enrolees..
This is a link to the Census Bureau that measures population there is also a population clock, you can see it running:
All numbers aside. The real problem here is cost. Cost not only associated to the number of people but more importantly, the cost of healthcare itself. We need to fix the things that make a medical procedure in the country cost 5 times the amount it does in most other countries. Did you know even though the procedure cost 5x more here the cost also rises disproportionally to the rest of the world? Until this is fixed. the system is doomed. ACA does not fix this. Competition is the only way I see to fix this. The number on uninsured is a SYMPTOM. The cause is unfordable health care. ACQA helps some afford health care by giving them money. That is NOT the same as making health care more affordable.
You are correct, some will say we live in a capitalist country therefore justifies the reason for high cost, they say let the market fix itself, BS, there needs to be limits on what procedures can cost, but I think it is the insurance companies the stock holders the people who benefits more financially more than the medical profession per se..."PHARMACEUTICAL COMPANIES" Manufacturers of Medical Equipment, Devices, all of that, they are the real culprits, so Obama did what he could to get more people insured to save their lives, this thing of typing health insurance to your Jobs is BS, I am glad that's over, people should not have to be attached to some shitty job just because that's the only way to be able to get Care, thank you PELOSI/REID/SEBELIUS/OBAMA..freedom from keeping people in Bondage...
As for the money, how about removing the subsidies for the Oil Companies, paying Farmers to not Farm and all the BS $$$$$$ we give to the Corporate Welfare Recipients, you know the money we give to the Rich to keep them Rich, change the tax codes and let those people pay the fair amount of taxes they are getting a deal on...
Agreed. This is also happening with insurance and drug companies and every other industry, GE, Monsanto, the list never ends.
I ran across some more data concerning the change in the number of insured/uninsured as a result of the PPACA
Well, you're finally coming around a little. Here's where I said that.
I've always loved math. The figures above aren't bad. They are only off by a couple of percent.
17.1-15.9 = 1.2 decrease
1.2/17.1 = 7.017544% decrease in uninsured not 9.3%
That is what I said above John on page two I think with the exception of A Mac's 9.3% comment at the top, which was incorrect. It was 7% as I stated.
Now there is a 1.2% change in insureds no matter whether you look at how many more became insured or how many less became uninsured based on the percentage change.
I showed both ways of looking at it and both ways are correct.
Like you said they needed 17.1% more to have all people insured.
I know you are a smart fellow, so accept there are two ways of analyzing it.
Look at this.
Let's say we've come along and now we only have 10% uninsured. Then during the next month or so we have 5% uninsured. Well I know you would realize we have cut the number of uninsured in half. So that would be a 50% change in percentage. Can't you see the headline, "Obama Has Cut the Uninsured Americans by 50%."
But if you looked at the big picture or at in another way, you could say we had 90% insured. And then during the next month or so we now have 95% insured.
This is the way it works. Now the percentage of change would be 5.556% change in the number of people insured. (5 divided by 90)
So I don't blame anyone to portray it the way it was portrayed in the article because it looks like it was a really big change when in fact 5, 6, 7 or even 8 million is a small percentage of 313,000,000 people. In other words the number of uninsured is a much smaller number than the number of insured. And the change or increase in insureds during the enrollment period was much smaller than that, although it is a larger percentage of change or decrease in the number of uninsured.
Enough of this. Moving on.