
NOAA Caught Rewriting US Temperature History (Again)


Here in the U.S. I have documented manipulations similar to those in Switzerland and other locations worldwide that NTZ wrote about yesterday.
Over the last months I have discovered that between 2013 and 2015 some government bureaucrats have rewritten Maine climate history between 2013 and 2015 (and New Englands and of the U.S.). This statement is not based on my opinion, but on facts drawn from NOAA 2013 climate data vs NOAA 2015 climate data after when they re-wrote it.
We need only compare the data.They cooked their own books (see numbers below).
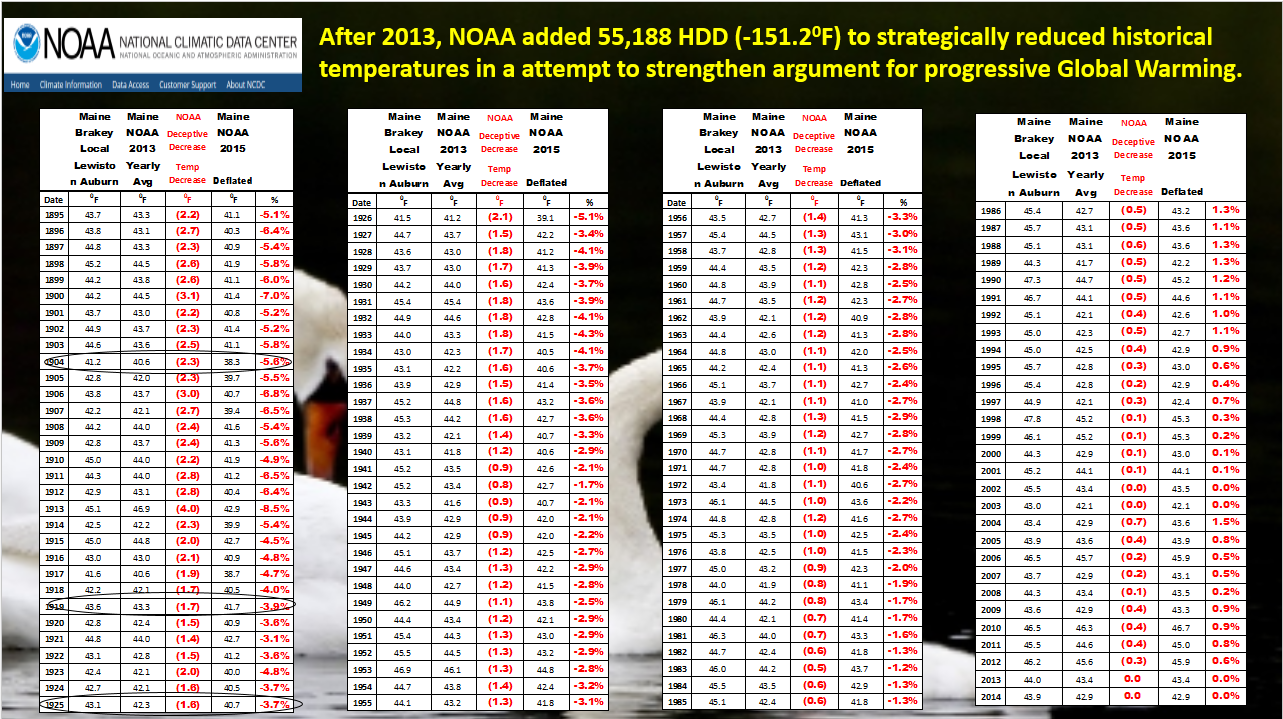
Figure 1: NOAA cooled the years of Maines past by an accumulated 151F! (55,188 heating degree day units).
The last four months have been some of the coldest you might ever recall in our lifetime.So far 2015 is the fourth coldest in Maines history over the last 120 years. Data from 2013 confirm that so far from January 1 to April 29 2015has required 4249 heating degree days.
That rivals 1904, 1918 and 1923 over the last 120 years.
But when I recently looked at NOAAs revised2015 data, these last four months now would not even put us in the top twenty of coldest months.The federal government went into the historical data and lowered those earlier years and other years in the earlier decades so that they can keep spending $27 billion a year on pushing global warming.
They assumed no one would archive temperature data. But I did. My research indicated they used the same algorithm across the United States at the same time.FortunatelyI had archived their data from 2013 for Maine and recently compared it to their 2015 data (see above table).
As an engineering physicist and heat transfer specialist, I have worked with heating and cooling degree days for forty years.It is alarming when one discovers multi-million dollar websites have been corrupted with bogus data because the facts do not match up with agendas.
It tremendously harms the industry you and I both work in. Worse, it harms the public. If the public knew the climate data facts indicated it was not getting warmer locally, and that it might actually be getting cooler, it would have all the more reason to insulate and become more energy-efficient in their homes.
I have put together a Maine history of climate temperatures in a narrated PowerPoint Presentation placed on YouTube titled, Black Swan Climate Theory .
Below is abrief samplingof my findings:

Table 1: Sampling of findings.
So far 2015 Maine temperatures, as of April, are running neck-and-neck with the coldest years in Maines history: 1904 (40.6F), 1918 (42.1F) and 1925 (42.3F).These temperatures cited come right fromthe federal governments ownNOAA climate data (from 2013). I archived them on my computer for future reference.
2015 so far among coldest on record
A BLACK SWAN event is forming in 2015 (following chart):

Figure 2: Plot comparing the new, altered dataset to the 2013 dataset. Black curve is the plot of the 2013 dataset. The blue curve is the plot of the 2015 new, altered data.
Based on the first four months of 2015, there is an excellent chance 2015 Maine temperature might average, on an annual basis, well under 43.0F.Not only have Maine temperatures been on a decline since 1998, we are now seeing temperatures reminiscent of the bitter turn of the early 1900s.
Massive rewrite
It appears NOAA panicked and did a massive rewrite of Maine temperature history (they used the same algorithm for U.S. in general).The new official temperatures from Maine between 1895 and present were LOWERED by an accumulated 151.2F between 1895 and 2012.
Out-and-out fraud
In my opinion, this is out-and-out fraud.Why did they corrupt national climate data?Global warming is a $27 billion business on an annual basis in the U.S alone.

Now NOAA data revised in 2015 indicate that 1904, 1919 and 1925 in Maine were much colder than anything we experience today.(See the scorecard above comparing the NOAA data that are 18 months apart).Note how for 1913 the NOAA lowered the annual temperature a whole 4F!
For the balance of the years, as they get closer to the present, the NOAA tweaks less and less.They have corrupted Maine climate data between 1895 and present by a whopping accumulated 151.2F.
Unfortunately NOAA is remaining true to that old saying, Figures dont lie but liars figure.
A multi-million dollar website has been corrupted.I can no longerrely on the tax-payer funded NOAA for clean, unfiltered, climate data for my ongoing research.
Conclusion
I can no longer trust the climate data and energy information ultimately drawn from the U.S. government. Locally, I nowhave to determine if they got their data from NOAA.
This makes research a lot tougher.
http://notrickszone.com/2015/05/02/151-degrees-of-fudging-energy-physicist-unveils-noaas-massive-rewrite-of-maine-climate-history/#sthash.hfRbwyGw.Wa7E1hPm.dpbs
Tags
Who is online

165 visitors
Climate fundies have been caught doing this on numerous occasions.
This kind of manipulation of data, changing the historical record after the fact, is done ALL THE TIME by the climate alarmists who crank out all of the data that are reported on in the newspapers. And the adjustments are always the same: they make the past cooler, so that the present will look warmer, in order to support their power-grabbing climate hysteria agenda. Whenever you hear on the radio that a temperature reading is the warmest ever in a particular place, you can reasonably assume that the warmest ever title was conferred by falsely reporting temperature readings from past decades.
...
All of Paraguay's temperature records have been tampered with:
fter identifying that all of the three rural stations currently operational in Paraguay had had huge warming adjustments made to their data since the 1950s, I tended to assume that they had been homogenised against some of the nearby urban stations. Ones like Asuncion Airport, which shows steady warming since the mid 20thC....
Silly me! When I went back to check the raw data, it turns out all of the urban sites had been tampered with in just the same way as the rural ones... Let me state again. These warming adjustments have taken place at every single, currently operational site in Paraguay.
NOAA should take up doing what their namesake Noah was best at ... building arks .
Myth of Arctic meltdown: Stunning satellite images show summer ice cap is thicker and covers 1.7million square kilometres MORE than 2 years ago...despite Al Gore's prediction it would be ICE-FREE by now
The speech by former US Vice-President Al Gore was apocalyptic. The North Polar ice cap is falling off a cliff, he said. It could be completely gone in summer in as little as seven years. Seven years from now.
Those comments came in 2007 as Mr Gore accepted the Nobel Peace Prize for his campaigning on climate change.
But seven years after his warning, The Mail on Sunday can reveal that, far from vanishing, the Arctic ice cap has expanded for the second year in succession with a surge, depending on how you measure it, of between 43 and 63 per cent since 2012.
Scroll down for video
To put it another way, an area the size of Alaska, Americas biggest state, was open water two years ago, but is again now covered by ice.
The most widely used measurements of Arctic ice extent are the daily satellite readings issued by the US National Snow and Ice Data Center, which is co-funded by Nasa. These reveal that while the long-term trend still shows a decline last Monday, August 25, the area of the Arctic Ocean with at least 15 per cent ice cover was 5.62 million square kilometres.
This was the highest level recorded on that date since 2006 (see graph, right), and represents an increase of 1.71 million square kilometres over the past two years an impressive 43 per cent.
Other figures from the Danish Meteorological Institute suggest that the growth has been even more dramatic. Using a different measure, the area with at least 30 per cent ice cover, these reveal a 63 per cent rise from 2.7 million to 4.4 million square kilometres.
The satellite images published here are taken from a further authoritative source, the University of Illinoiss Cryosphere project.
They show that as well as becoming more extensive, the ice has grown more concentrated, with the purple areas denoting regions where the ice pack is most dense increasing markedly.
Crucially, the ice is also thicker, and therefore more resilient to future melting. Professor Andrew Shepherd, of Leeds University and University Coillege, London, an expert in climate satellite monitoring, said yesterday: It is clear from the measurements we have collected that the Arctic sea ice has experienced a significant recovery in thickness over the past year.
It seems that an unusually cool summer in 2013 allowed more ice to survive through to last winter. This means that the Arctic sea ice pack is thicker and stronger than usual, and this should be taken into account when making predictions of its future extent.
The speech by former US Vice-President Al Gore (above) was apocalyptic. He said that the North Polar ice cap is falling off a cliff and could be gone in seven years
Yet for years, many have been claiming that the Arctic is in an irrevocable death spiral, with imminent ice-free summers bound to trigger further disasters. These include gigantic releases of methane into the atmosphere from frozen Arctic deposits, and accelerated global warming caused by the fact that heat from the sun will no longer be reflected back by the ice into space.
Judith Curry, professor of earth and atmospheric sciences at Georgia Institute of Technology in Atlanta, said last night: The Arctic sea ice spiral of death seems to have reversed.
Those who just a few years ago were warning of ice-free summers by 2014 included US Secretary of State John Kerry, who made the same bogus prediction in 2009, while Mr Gore has repeated it numerous times notably in a speech to world leaders at the UN climate conference in Copenhagen in 2009, in an effort to persuade them to agree a new emissions treaty.
Mr Gore whose office yesterday failed to respond to a request for comment insisted then: There is a 75 per cent chance that the entire polar ice cap during some of the summer months could be completely ice-free within five to seven years.
Misleading as such forecasts are, some people continue to make them. Only last month, while giving evidence to a House of Lords Select Committee inquiry on the Arctic, Cambridge Universitys Professor Peter Wadhams claimed that although the Arctic is not ice-free this year, it will be by September 2015.
Asked about this yesterday, he said: I still think that it is very likely that by mid-September 2015, the ice area will be less than one million square kilometres the official designation of ice-free, implying only a fringe of floes around the coastlines. That is where the trend is taking us.
For that prediction to come true it would require by far the fastest loss of ice in history. It would also fly in the face of a report last year by the UN Intergovernmental Panel on Climate Change (IPCC), which stated with medium confidence that ice levels would likely fall below one million square kilometres by 2050.
Politicians such as Al Gore have often insisted that climate science is settled and have accused those who question their forecasts of being climate change deniers.
However, while few scientists doubt that carbon-dioxide emissions cause global warming, and that this has caused Arctic ice to decline, there remains much uncertainty about the speed of melting and how much of it is due to human activity. But outside the scientific community, the more pessimistic views have attracted most attention. For example, Prof Wadhamss forecasts have been cited widely by newspapers and the BBC. But many reject them.
Yesterday Dr Ed Hawkins, who leads an Arctic ice research team at Reading University, said: Peter Wadhamss views are quite extreme compared to the views of many other climate scientists, and also compared to what the IPCC report says.
Dr Hawkins warned against reading too much into ice increase over the past two years on the grounds that 2012 was an extreme low, triggered by freak weather.
Im uncomfortable with the idea of people saying the ice has bounced back, he said.
However, Dr Hawkins added that the decline seen in recent years was not caused only by global warming. It was, he said, intensified by natural variability shifts in factors such as the temperature of the oceans. This, he said, has happened before, such as in the 1920s and 1930s, when there was likely some sea ice retreat.
Dr Hawkins said: There is undoubtedly some natural variability on top of the long-term downwards trend caused by the overall warming. This variability has probably contributed somewhat to the post-2000 steep declining trend, although the human-caused component still dominates.
Like many scientists, Dr Hawkins said these natural processes may be cyclical. If and when they go into reverse, they will cool, not warm, the Arctic, in which case, he said, a decade with no declining trend in ice cover would be entirely plausible.
Peer-reviewed research suggests that at least until 2005, natural variability was responsible for half the ice decline. But exactly how big its influence is remains an open question and as both Dr Hawkins and Prof Curry agreed, establishing this is critical to making predictions about the Arctics future.
Prof Curry said: I suspect that the portion of the decline in the sea ice attributable to natural variability could be even larger than half.
I think the natural variability component of Arctic sea ice extent is in the process of bottoming out, with a reversal to start within the next decade. And when it does, the reversal period could last for several decades.
This led her to believe that the IPCC forecast, like Al Gores, was too pessimistic.
Ice-free in 2050 is a possible scenario, but I dont think it is a likely scenario, she concluded.
The apparent recovery in Arctic ice looks like good news for polar bears.
If there is more ice at the end of the summer, they can hunt seals more easily. Yet even when the ice reached a low point in 2012, there was no scientific evidence that bear numbers were declining, with their estimated total of 20,000 to 25,000 thought to be higher than in the 1970s, when hunting was first banned.
In many Arctic regions, say scientists, they are in robust health and breeding successfully.
Computer model predictions of decline caused by ice melt have also failed to come true. In 2004, researchers claimed Hudson Bay bear numbers would fall from 900 to fewer than 700 by 2011. In fact, they have risen to over 1,000.
However, the main international bear science body, the Polar Bear Specialist Group, admits it has no reliable data from almost half of the Arctic, so cannot say whether numbers are falling or rising.
"And if all others accepted the lie which the Party imposedif all records told the same talethen the lie passed into history and became truth. 'Who controls the past' ran the Party slogan, 'controls the future: who controls the present controls the past.' " George Orwell
I fully expect to find out in a few years that I wasactuallyborn in an ice age.