
The Government's a Drag on Employment


The jobs recovery of the past five years looks a lot like the early and middle stages of the recoveries from the previous two recessions, I wrote Friday . Here's the chart that inspired this observation:
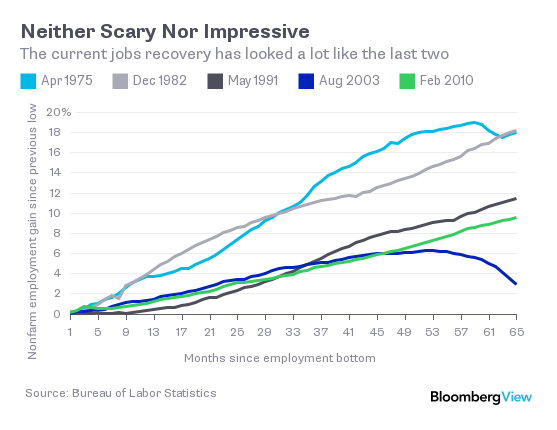
The employment rebound that began in 2003 ended early, and the one that began in 1991 went on and on, but in terms of the rate of increase those two recoveries and the current one look quite similar, especially in comparison with earlier, stronger recoveries. This set Aaron Pressman of Yahoo Finance to wondering. Maybe, he mused on Twitter , Ishouldseparate government employment from private-sector employment and see what the chart looked like then. So I did.
When you just look atprivate-sector jobs, which accounted for 85 percent of total nonfarm jobsin July, the storyisn't all that different.
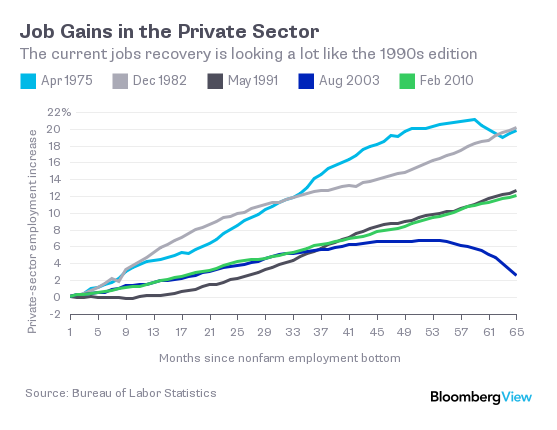
The main difference between this and the first chart is that the current recovery looks a even more like the long 1990s recovery and less like the short-lived 2000s rebound.
The government-jobs picture is another matter entirely.
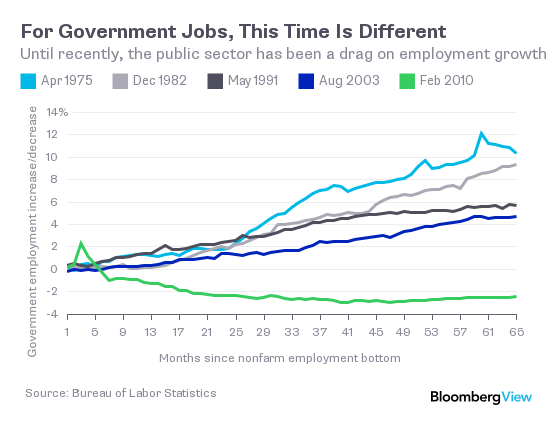
One interesting thing here is that with each successive recovery, government-employment growth has been a little slower. And of course the really interesting thing is that, over the course of the current recovery, government employment has actually declined. Yes, ithasbeeninching up again since the beginning of last year, but overall there were 553,000 fewer people working in government jobs in July than there were in February 2010. Most of the decline was in state and local government employment, although federal government employment is down a little, too. Also, in case you're wondering about that big spike in government employment in 2010, that was a bunch of temporary Census workers.
The Bureau of Labor Statistics's payroll employment numbers don't include uniformed military . And yes,
Employees of the Central Intelligence Agency, the National Security Agency, the National Imagery and Mapping Agency, and the Defense Intelligence Agency also are excluded.
Hmmm, don't know if I can get my hands on those numbers. For uniformed military there is at least an annual accounting from the Department of Defense. Itshows declines since 2010 but modest ones -- there were 1.34 million men and women in uniformin September 2014 and 1.43 million inSeptember 2010. Over the course of the 1990s, by comparison, the number of uniformed military fell from 2 million to just under1.4 million. Factor that in, and government employment actually grew much more slowly during the 1990s recovery than during the 2000s one.
It didn't shrink , though. The fiscal policychoices made during the current recovery have been unique in modern American experience. There were reasons for these choices-- the worst recession in 75 years left governments at all levels dealing with huge budget shortfalls. Butthey've definitely been a drag on overall employment growth.
http://www.bloombergview.com/articles/2015-08-10/goverment-has-been-a-major-drag-on-employment
Tags
Who is online

88 visitors
There are a great many similarities between the current recovery and the recoveries from past recessions and significant drops in employment, but there is a single stark difference.
Public sector employment is not coming back as it has in the past - economies and efficiencies in government are certainly desirable things and that explains part of the drop in public sector employment, but drastic cuts in some areas have hurt efficiency.