
╌>

US September trade deficit lowest in more than five years as goods exports soar | Reuters

  

Category:  News & Politics

Via:  vic-eldred  •  11 months ago  •  26 comments

By:   Mark Potter (Reuters)

US September trade deficit lowest in more than five years as goods exports soar | Reuters

The U.S. trade deficit unexpectedly narrowed in September, touching the lowest level in more than five years, as exports accelerated and imports rose marginally, suggesting that trade likely provided a boost to economic growth in the third quarter.

S E E D E D   C O N T E N T


Economists polled by Reuters had forecast the trade deficit increasing to $63.3 billion. The report was delayed because of the 43-day shutdown of the government.

Exports climbed 3.0% to $289.3 billion in September.

Goods exports surged 4.9% to $187.6 billion, with shipments of consumer goods increasing to a record high.

Imports rose 0.6% to $342.1 billion. Goods imports advanced 0.6% to $266.6 billion. But imports of automotive vehicles, parts and engines were the lowest since November 2022.

The goods trade deficit compressed 8.2% to $79.0 billion, the lowest level since September 2020.

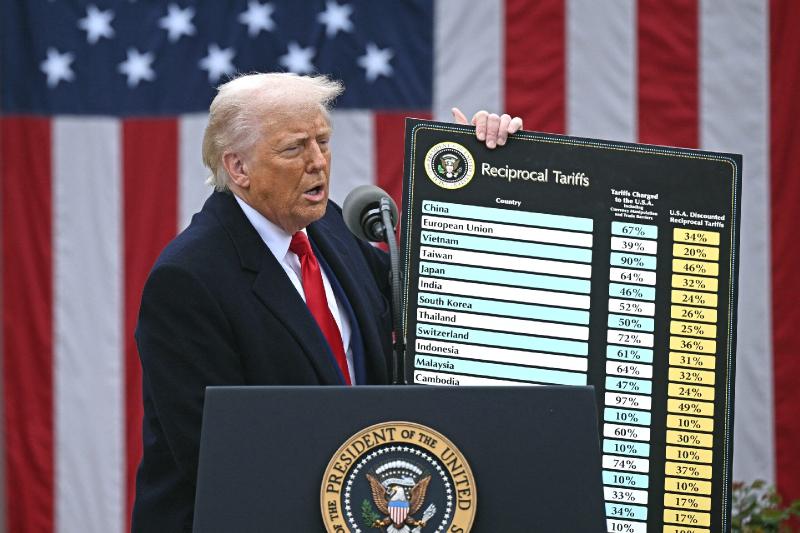
President Donald Trump's protectionist trade policy, marked by sweeping tariffs, has caused big swings in the trade deficit, distorting the overall economic picture.

Trade sliced off a record 4.68 percentage points from gross domestic product in the first quarter before adding all that back to GDP in the April-June quarter. Prior to the trade data, the Atlanta Federal Reserve estimated GDP increased at a 3.5% annualized rate in the third quarter. The government will release its first estimate of third-quarter GDP on December 23 after it was delayed by the longest shutdown in history.

The economy grew at a 3.8% pace in the April-June quarter.


Reporting by Lucia Mutikani. Editing by Mark Potter


Tags

jrDiscussion - desc
[]
 
Vic Eldred
Professor Principal
1  seeder  Vic Eldred    11 months ago

The economy is growing again!


Hallux
Professor Principal
1.1  Hallux  replied to  Vic Eldred @1    11 months ago

256


Vic Eldred
Professor Principal
1.1.1  seeder  Vic Eldred  replied to  Hallux @1.1    11 months ago

G78EnVnWsAAq8up?format=jpg&name=small


Jeremy Retired in NC
Professor Guide
1.1.2  Jeremy Retired in NC  replied to  Vic Eldred @1.1.1    11 months ago

Just paid $2.47 to fill my car.  


Vic Eldred
Professor Principal
1.1.3  seeder  Vic Eldred  replied to  Jeremy Retired in NC @1.1.2    11 months ago

In some states it is even less. Believe it or not the average price in CA is $4.50 per gallon.

I recall when Obama said that the price of gas was one of the single most important issues to voters. That makes me wonder who is voting in California.


Hallux
Professor Principal
1.1.4  Hallux  replied to  Vic Eldred @1.1.1    11 months ago

How is a Dell (Trump) Account better than a 529 account?

How is that 'task force' doing with the price of coffee?

Farmer Aid Packages have existed for decades.

Gas prices falling from $3.02 to $2.93? Wowza!

No tax on tips/overtime ... yippie-oy-vey, 90% of tip earners already don't make enough to be taxed ... hopefully they are being warned to steer clear of using this 'deduction' that may well remove them from other benefits.


Jeremy Retired in NC
Professor Guide
1.1.5  Jeremy Retired in NC  replied to  Vic Eldred @1.1.3    11 months ago
In some states it is even less.

And others much more.  Most of what I've seen from Democrat run shitholes (i.e. California, Washington) it's almost $5 a gallon still.


Vic Eldred
Professor Principal
1.1.6  seeder  Vic Eldred  replied to  Hallux @1.1.4    11 months ago

Look at it from this angle:

Gaaay9aXMAA62Tg?format=jpg&name=900x900


Jeremy Retired in NC
Professor Guide
1.1.7  Jeremy Retired in NC  replied to  Hallux @1.1.4    11 months ago
yippie-oy-vey, 90% of tip earners already don't make enough to be taxed

Minimum ability = minimum pay.  Want better pay, make yourself worth it.  Demanding higher pay for minimum effort jobs is only going to drive prices higher or bring in AI to do those jobs and you'll get no pay.


Vic Eldred
Professor Principal
1.1.8  seeder  Vic Eldred  replied to  Jeremy Retired in NC @1.1.5    11 months ago

They still want to force Americans to buy electric cars.


Jeremy Retired in NC
Professor Guide
1.1.9  Jeremy Retired in NC  replied to  Vic Eldred @1.1.8    11 months ago

Still not buying one.  My '71 Challenger, 2020 Explorer are still cheaper to maintain and operate.


Hallux
Professor Principal
1.1.10  Hallux  replied to  Vic Eldred @1.1.6    11 months ago

Sure, now let's get to what matters ... who produced this graph?

I'll give you the day to reply, I have blood tests scheduled.


Hallux
Professor Principal
1.1.11  Hallux  replied to  Jeremy Retired in NC @1.1.7    11 months ago

So those 200,000 tech jobs being lost per year are minimum effort ... gee thanx STEM; you said you were the future. @!@ Save the crap for those who still buy into it.


Jeremy Retired in NC
Professor Guide
1.1.12  Jeremy Retired in NC  replied to  Hallux @1.1.11    11 months ago
So those 200,000 tech jobs being lost per year are minimum effort

I never said anything remotely close to that.  Is that from your imagination?


Right Down the Center
Professor Participates
1.1.13  Right Down the Center  replied to  Jeremy Retired in NC @1.1.7    11 months ago
Minimum ability = minimum pay.  Want better pay, make yourself worth it. 

Makes more sense than striking to get 20 per hour to make someone's coffee


JohnRussell
Professor Principal
1.1.14  JohnRussell  replied to  Hallux @1.1.4    11 months ago

Trump has said , 14 times since the spring, that gas prices are $1.98


Jeremy Retired in NC
Professor Guide
1.1.15  Jeremy Retired in NC  replied to  Right Down the Center @1.1.13    11 months ago

And fucking that simple task up.


Hal A. Lujah
Professor Participates
1.1.16  Hal A. Lujah  replied to  JohnRussell @1.1.14    11 months ago

Well that’s how much gas was the last time he was at the pump, which is never.


TᵢG
Professor Principal
1.1.17  TᵢG  replied to  Vic Eldred @1.1.6    11 months ago

Gawd, Vic, why do you continue to post bullshit like this?   

Every time a Trump supporter posts cherry-picked / fake / exaggerated / ... crap like this you just emphasize that to support Trump one must lie.

I gave your chart to ChatGPT and am letting it explain to you, in detail, where you are wrong:

Below is a fact-based, point-by-point rebuttal to the claims in the image. Each number in the graphic is misleading, cherry-picked, or outright false, and the comparison itself is invalid because:

Kamala Harris has never been president, so there is no economic dataset “under Kamala.”
All data during Biden–Harris is Biden-era macroeconomic data, shaped overwhelmingly by pandemic aftershocks, not vice-presidential decision-making.

With that clear, here are the real numbers from the Federal Reserve, BLS, BEA, and JPMorgan Research.


1. MORTGAGE RATES

Claim:

  • Trump: 2.77%

  • Kamala: 7.75%

Reality:

  • 2.77% occurred once in late 2020 during an unprecedented pandemic recession when the Fed pushed rates to 0%.

  • Trump’s typical mortgage rates before COVID were 3.7%–4.9% (2017–2019 average ≈ 4.2%).

  • The 2021–2023 rise to 7–8% is almost entirely due to:

    • The Fed hiking rates 11 times to combat global post-pandemic inflation

    • Pandemic savings, supply shocks, housing shortage

    • Trump’s 2020 stimulus + shutdown + supply chain collapse

No vice president controls interest rates.
Mortgages follow the Federal Reserve, not the White House.

Fact: Mortgage rates rose globally in 2021–2023 — the UK, Canada, Australia, EU saw similar or higher increases.


2. PERSONAL SAVINGS

Claim:

  • Trump: +385%

  • Kamala: –73%

Reality:

The “+385%” number refers to the brief COVID spike in the personal saving rate when:

  • The economy was shut down

  • People couldn’t spend

  • Congress passed multi-trillion-dollar stimulus checks

Savings jumped artificially to 34% in April 2020 — the highest in U.S. history — and then immediately collapsed as lockdowns ended.

This spike had nothing to do with Trump policy, and economists universally treat it as a pandemic anomaly.

Under Biden (not “Kamala”):

Savings normalized to 5–7%, roughly the 2015–2019 pre-COVID range.

Fact: There is no standard economic metric showing savings “–73% under Kamala.”
It is fabricated.


3. CREDIT CARD DELINQUENCY

Claim:

  • Trump: –11%

  • Kamala: +50%

Reality:

Credit card delinquency fell during COVID because:

  • Borrowers received stimulus checks

  • Banks paused collections

  • Interest holidays existed

  • Spending collapsed

This created an artificial drop in delinquencies, again unrelated to Trump “policies.”

Current delinquency rates:

  • Q4 2019 (pre-COVID): 2.36%

  • Q4 2023: 2.77%
    (Source: New York Federal Reserve Q4 2023 Household Debt Report)

That is an 18% increase, not 50%.

Delinquencies today are normalizing to 2010–2019 levels, not exploding.


4. REAL WEEKLY WAGES

Claim:

  • Trump: +8.2%

  • Kamala: –3.9%

Reality:

  • Real wages fell slightly during Trump’s first 3 years.

  • The entire +8.2% comes from the COVID crash, when low-income jobs disappeared temporarily, artificially raising average wages.

Because:

If 8 million low-wage workers lose jobs, the average wage rises —
even though no one actually got a raise.

This is called a composition effect, and economists do not treat it as real income growth.

Under Biden:

  • Real wages rose faster than inflation since mid-2022.

  • As of 2024, real wages are higher than pre-COVID for middle and lower workers.

The “–3.9%” figure is cherry-picked mid-2021, when inflation spiked globally.

Today, real wages are positive year-over-year, not negative.


5. The fundamental flaw

The chart compares:

  • Trump’s best cherry-picked pandemic numbers
    to

  • Harris’s worst cherry-picked inflation-peak numbers

It is a propaganda technique, not data analysis.

Every economist in the Federal Reserve, CBO, and major banks attributes the 2021–2023 economic distortions to:

  • Pandemic shutdown

  • Pandemic stimulus

  • Trump-era supply chain collapse

  • COVID policy emergency responses

  • Global inflation (not U.S.-specific)

None of these are the result of “Kamala policies.”


6. Summary

These numbers are fabricated or cherry-picked. Mortgage rates were only 2.77% during the COVID emergency when the Fed forced rates to zero; they were 4–5% under Trump normally. Personal savings and reduced delinquencies were also just temporary COVID anomalies caused by stimulus checks, not economic strength. The claimed wage gains under Trump are simply the statistical effect of low-income workers losing their jobs — not real wage growth. Meanwhile, the negative figures attributed to “Kamala” are taken from the global post-COVID inflation peak, not from any policies she implemented. This entire chart is a misleading comparison of Trump’s best emergency-stimulus month versus Harris’s worst inflation-spike month, not an honest economic analysis.


Hal A. Lujah
Professor Participates
1.1.18  Hal A. Lujah  replied to  TᵢG @1.1.17    11 months ago

Damn.  I was just about to make a call for a 2.77% refi.  Lol.


TᵢG
Professor Principal
1.1.19  TᵢG  replied to  TᵢG @1.1.17    11 months ago

ChatGPT provided supporting facts so that you can verify accuracy:

Here is a compact reality-check table for the four claims in the graphic, using the best official series that actually track these things. I’ll compare:
  • Late-Trump pre-COVID years (2017-2019 averages)

  • Recent Biden/Harris years (2023-2024 averages or latest data)

All data are national, not cherry-picked weeks.


1. 30-year mortgage rates

Metric Meme: “Under Trump” Meme: “Under Kamala” What official data show
Average 30-year fixed mortgage rate 2.77% 7.75% Freddie Mac annual averages: 2017 = 3.99%, 2018 = 4.54%, 2019 = 3.94% (≈ 4.2% pre-COVID under Trump). 2023 = 6.81%, 2024 ≈ 6.7% (≈ 6.7–6.8% recent).( The Mortgage Reports )
Key context – – The record low 30-year average of 2.96% occurred in 2021 , after Trump left office, during Biden’s term.( The Mortgage Reports )

Bottom line: The meme’s 2.77% “under Trump” number is lower than any annual average in his term and actually closer to the 2021 pandemic low under Biden. Current rates are high versus 2020–21, but not 7.75% on average.


2. Personal savings

Metric Meme: “Personal savings +385% / –73%” What the data show
Personal saving rate, annual avg 2017 = 5.8%, 2018 = 6.4%, 2019 = 7.3% (Trump pre-COVID avg ≈ 6.5% ). 2022 = 3.3%, 2023 = 5.6%, 2024 = 5.4% (recent avg ≈ 4.8–5.5% ).( YCharts )
Pandemic spike – In 2020 the saving rate jumped to 15.3% because of COVID shutdowns and stimulus checks, then slowly normalized.( YCharts )

Bottom line: Savings did not “rise 385%” under Trump nor “fall 73%” under Harris/Biden. They were mid-single-digit percentages before COVID, spiked in 2020, and are now back near pre-pandemic levels.


3. Credit-card delinquency

Metric Meme: “–11% vs +50% delinquency” What the data show
Trend Claims big drop under Trump and 50% jump under Harris/Biden Fed researchers report that credit-card delinquencies fell to record lows in early pandemic , then returned to pre-pandemic levels by 2023:Q1 and are now about 1.25 percentage points above those early-2023 levels , i.e., somewhat higher than 2019 but not an unprecedented explosion.( Federal Reserve )

Bottom line: Delinquencies are up from the artificially low pandemic trough, but are broadly in the same ballpark as late-2010s levels. The “–11% / +50%” framing seriously distorts the scale and ignores that Trump’s term also ended with a huge COVID shock.


4. Real weekly wages

Metric Meme: “Real weekly wages +8.2% vs –3.9%” What the data show
Recent movements Meme claims big real-wage gains under Trump, large losses under Harris/Biden BLS data show real average weekly earnings rose modestly in 2018–2019, then fell in 2022–early 2023 as inflation spiked, and have been rising again since 2023 . From Dec-2023 to Dec-2024, real weekly earnings rose 0.7% , and from Sep-2024 to Sep-2025 they rose another 0.7% .( Bureau of Labor Statistics )

Bottom line: Real wages have been squeezed by inflation then partly recovered; the net effect since 2020 is roughly flat to slightly up depending on series and time window. There is no reputable series that supports +8.2% under Trump vs –3.9% under Biden/Harris.


Overall takeaway

The graphic:

  • Cherry-picks extreme or misleading numbers (e.g., using a pandemic-era low mortgage rate that happened under Biden, not Trump).

  • Ignores context (COVID stimulus, Fed rate cycle, global inflation) that drove most of these indicators.

  • Misrepresents trends , especially for savings, delinquencies, and real wages.


bugsy
Professor Participates
1.1.20  bugsy  replied to  JohnRussell @1.1.14    11 months ago
Trump has said , 14 times since the spring, that gas prices are $1.98

How many times did the last admin say the border was closed?


Tacos!
Professor Guide
1.1.21  Tacos!  replied to  Vic Eldred @1.1.3    11 months ago
That makes me wonder who is voting in California.

People who like functional lungs. 


Tacos!
Professor Guide
1.1.22  Tacos!  replied to  Vic Eldred @1.1.6    11 months ago

What do you mean “under Kamala?” When was she president?

Side note: why is it we refer to male politicians by their last name, but female politicians by their first name?


TᵢG
Professor Principal
2  TᵢG    11 months ago
Exports climbed 3.0% to $289.3 billion in September.  Goods exports surged 4.9% to $187.6 billion, with shipments of consumer goods increasing to a record high.

The historical trend is that exports rise and fall each year.  3% growth is not remarkable, so you are trying to give credit to Trump for something that happens normally:

800

For the past 25 years:

Year Exports % Change
1/1/2000 1322.64
1/1/2001 1248.809 -5.6%
1/1/2002 1224.411 -2.0%
1/1/2003 1250.203 2.1%
1/1/2004 1370.771 9.6%
1/1/2005 1466.005 6.9%
1/1/2006 1604.922 9.5%
1/1/2007 1745.535 8.8%
1/1/2008 1846.597 5.8%
1/1/2009 1693.098 -8.3%
1/1/2010 1907.258 12.6%
1/1/2011 2044.164 7.2%
1/1/2012 2126.302 4.0%
1/1/2013 2190.311 3.0%
1/1/2014 2275.784 3.9%
1/1/2015 2283.058 0.3%
1/1/2016 2293.881 0.5%
1/1/2017 2388.26 4.1%
1/1/2018 2456.423 2.9%
1/1/2019 2469.535 0.5%
1/1/2020 2157.811 -12.6%
1/1/2021 2297.168 6.5%
1/1/2022 2472.061 7.6%
1/1/2023 2541.04 2.8%
1/1/2024 2633.598 3.6%

The goods trade deficit compressed 8.2% to $79.0 billion, the lowest level since September 2020.

800

The trade deficit has fluctuated considerably over the past 25 years.   Again, there is nothing remarkable about the recent moves other than the recovery from the huge spike in the first quarter of 2025.   This indicates something extraordinary that took us off track, but we are now back on track.  To wit, the following quote is true:

President Donald Trump's protectionist trade policy, marked by sweeping tariffs, has caused big swings in the trade deficit, distorting the overall economic picture.

Yeah, his idiotic tariffs caused big swings.   To accomplish what, exactly, would be the question.   (Note:  the above quote from the article is not praising Trump's policies. )

The economy grew at a 3.8% pace in the April-June quarter.

Our GDP growth pace (the percentage change) varies but is typically positive.   There is nothing special about this growth.

800

So while you might think this report shows that Trump has accomplished something, when the numbers are viewed from an historical perspective it merely shows that global and domestic economics has largely shrugged off Trump's idiotic moves.   For now.


But one thing that Trump was supposed to fix was prices.   Our CPI continues to rise.   We should, with a straight-line projection be about 290 right now, but we are at 323 and this will almost certainly worsen:

800

This is not an A +++++ performance, more like a C - .


George
PhD Expert
3  George    11 months ago

[✘]


Who is online


147 visitors