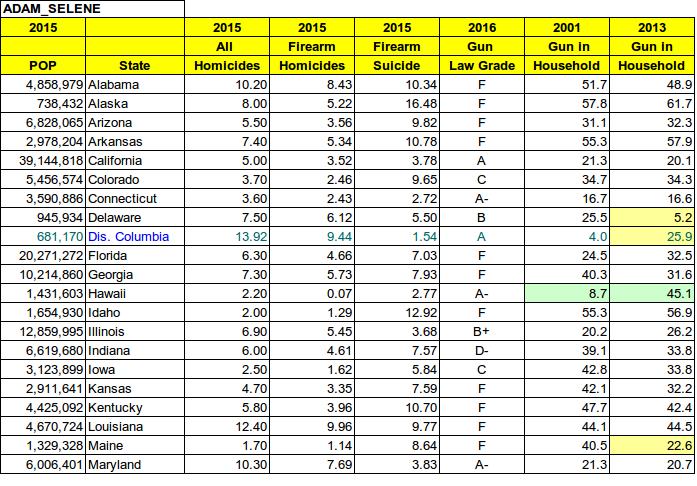
States and Firearm Data

An interactive table containing data on firearm ownership, gun laws, and firearm related deaths.
A click on the Table Picture should take you to an interactive spreadsheet with filters.
In the interactive table, clicking on the to sort the columns.
Explanation of Table Headings
-
Pop – Population of State 2015
-
State – Name of State
-
2015 All Homicides – for a state – should not include Suicide
-
2015 All Gun Homicides for a state – should not include Suicide
-
2015 Firearm Suicide for a state
-
2016 Firearm Law Grade for a state - http://gunlawscorecard.org/ rates the firearm laws of a state. Generally, more restrictive laws get an A or A- grade. At this time I could not find the scorecard for 2015.
-
2001 Firearm in Household – this is an old but very large study.
-
2013 Firearm in Household - It's useful to have the two studies is to compare changes. (The number households that have one or more functioning firearms of any type. Some focus on the number of firearms per individual or state or country. I believe the number of households is the important metric. Certainly a topic for discussion.)
-
2013 Increase, Decrease – the difference (Large changes deserve additional study. The data could be wrong. Yes people lie – but it often averages out. I assumed the Hawaii data was incorrect – but it appears to support articles that describe a large increase in gun registrations.)
-
2015 Population Density per Square Mile – looks like there might be a relationship to low population density and suicide.
-
2015 All Types of Suicide Rate – in all cases this should be greater than the 2015 Firearm Suicide rate.
-
2005 All Types of Suicide Rate – At this time I could not find 2001 data
-
2015- '05 Increase Decrease – all types of Suicide. It would be useful to find 2001 or 2005 Firearm related Suicide rates.
-
2017 Trump's Approval Rating – Nothing flippant here – just a guess that there might be a lot of socioeconomic data packed into the President's approval rating.
Tags
Who is online


49 visitors
There does not seem to be any real relationship to the number of households with firearms and firearm homicides but there does seem to be a relationship to firearm suicides.
Where did you get this information?
Linkage please?
Never mind..... I found it.....
There is one major problem with this aside from it's obvious political bias.
The data makes no sense whatsoever. They are cross correlating different years data to come to their conclusions. And some of their info is flat out wrong.....
This is the problem with such things that was identified in the last CDC study, you know the one President Obama commissioned. The one he didn't expect to come out the way it did, in fact, no liberal gun controller liked?
The one that said there is no way to come up with any serious plan or policy to curb or control gun violence for any agency on the basis of current data?
And there is no likelihood of ever getting the data needed for such?
That study? Signed off by most of the scientists that have studied the gun issue for decades?
From Kellerman to Kleck, the two most read and argued gun study scientists. (from opposite sides of the debate, strangely both from the same political side)
This website ( the law center to prevent gun violence ) and their organization is a joke......
E.A Only because " Guns " are not the Problems, and ALL of the US of A Economy is " Weapons and armament Export " related, see who is the world largest Mine seller!
Excuse me, what does military weapons export have to do with private citizen ownership of weapons and those that wish to control such?
Sorry I got tired and took a brea . Please check the above for "TABLE SOURCES" that I added.
As much as possible 2015 data was used. There was no cherry picking - this is the publicly available data. Give me better data - I will give you a better table. Take a look at myhttps://thenewstalkers.com/community/discussion/35036/The%20data makes no sense whatsoever. They are cross correlating different years data to come to their conclusions. And some of their info is flat out wrong...." target="_blank" rel="noopener"> TABLE SOURCES link if you think I was cutting corners. Trends usually do not change over night so there is still value in some older data.
Excellent - please give me a link to the correct data and I will update the table.
No attempt was made to cherry pick - not sure how you came up with that one. Do I have a bias - well yes. Many years ago I belonged to the NRA when their focus was on game preservation. They are now a lobbying group whose power exceeds their base.
But - firearms - nope I don't have a problem with them.
Do you disagree that state they give an "A" to will have fairly restrictive firearm laws and that states they give "F"'s to have more liberal laws? Do they appear to have a bias against ownership - sure appears that they do. It doesn't invalidate that their data reflects how restrictive a state's laws are.
Again - you protest the quality of the data. Give me better data and I will update the table. You will find me to be an honest broker.
This article might help clear this up a bit. Note - the Republicans are in complete control. I hope they will FUND and extensive and long range study.
E.A its a test of " Vision " if one is Myopic on One Chart, what are the odds they can see another?
Really? Scientists don't use vision (as your using it) to correlate actual data....
YOU can believe anything you want, doesn't make it valid nor real...
The problem I have?
Without consistent accurate data from all sources, the correlations or extrapolations of logic are faulty at their core.
You cannot draw conclusions of data that does not come from the same set of samples with a consistent form.
That is the problem the CDC had with any reporting on firearm fatalities and trying to draw conclusions from the current databases and use those conclusions to formulate policy.... (or even a plan towards policy)
You have to get everyone on the same reporting page reporting the same data covering all the various possibilities nationwide from all reporting agencies from all angles.
WE NEED CONSISTENT DATA which unfortunately no one has.
The CDC recommended that a plan be formulated to correct this and implement data collections standards for all agencies. But one MUST understand that such accurate data is what is NOT wanted by any side....
They don't want to know what is actually going on based upon provable fact......
Cause if they did, they would actually have to do something about it......
There are many valid points on both sides points that support both sides and points that debunk the oppositions points on both sides.
Until we have consistent data collection and reporting we will never know which does which which point is valid and which aren't...
That is the conclusion the CDC came to.....
There is no point in even discussing anything about the issue until we have it.....
You want an example?
DGU's (defensive gun uses) are estimaterd a bit on the conservative side, (the liberal side) at some 400k per year, on the Gun owners side at about 2.5 million per year. Hell they don't even know how they should be classified much less accurate statistics on how often.... The CDC said they have to be accounted for in formulating good policy, but how do you go about tracking such? Liberals/democrats do not want them counted cause they will lose the argument about the good that guns do in preventing and reducing crime amongst the citizenry Gun rights advocates/ republicans insist that they be counted specifically cause it WILL eliminate that argument......
To me is is simple common sense from knowledge drawn form criminal themselves that they would be more apt to attack a person without a weapon that a person with one. They state that their one worst fear when breaking and entering is a person inside with a weapon.....
But liberals reject that out of hand cause it doesn't fit their agenda.
Without accurate correlated data any comparison table like you are compiling and the linked website has compiled is wrong before it is even tallied.....
Any conclusions drawn are flawed from the start. This it the current problem with all the competing studies. for every democrat study there is a republican one refuting it and vice versa.
I don't care what data you used or where you got it from, you are trying to pass off correlations that cannot be factually made cause the data is inconsistent.
Actually, it isn't worth an intelligent persons time to debate it...
I couldn't agree more. However even imperfect data has value if you use it carefully.
For example - look at Hawaii and the change in household ownership of firearms from 1001 to 2013. Are the rates exactly correct - of course not. Would 2015 be better than 2013 - yes. Is the comparison without value?
No - because it lead me to research ownership trends in Hawaii. There really has been a large increase. And yet it has a very low homicide and gun homicide rate. Hawaii is our Switzerland.
You would then notice the odd numbers from New Hampshire extremely low homicide and gun homicide numbers but an extremely high rate of gun suicides. That lead me to the Gun Shop Project. Suicide actually is a tragic problem in New Hampshire - far greater than any of the bordering states.
The purpose of the table data is not to do multiple regression but to identify areas that deserve more intensive research.
Imperfect though the data is - it still has value.
Intelligent people can usually find a way to make use of it.
The point the CDC made is intelligent people can stroke the current data all they want coming up with erroneous conclusions.
They are still erroneous conclusions.
No scientists worth their salt will continue to do such until the main problem is fixed....
The result of said study, and the CDC dropping the desire to do more studies did result in one thing. there are myriad fringe groups that no one has heard of that are still trying to stroke said data to suit an agenda. This group you have linked to is one such group.
I've been following the gun control studies debate for over 15 years, and your article is the first time I have ever heard of them....
Yes someone has a broken hammer, useless for driving nails, but there are other uses that the broken hammer can be put to, by very industrious, clever people, but usually ineffective ones....
Current data is ineffective as a tool to make policy.
And that is the long and the short of it.
Any conclusions will be faulty to the level the data is faulty.
Old garbage!
While that anti gun chart was being made this was in WAPO.
https://www.washingtonpost.com/news/wonk/wp/2015/12/03/weve-had-a-massive-decline-in-gun-violence-in-the-united-states-heres-why/?utm_term=.e2c7c2001b01
Excellent link - thank you - it shows the increase in gun related suicides - which you will also find expressed in the table.
Ready access to firearms in the home seems to relate to a higher rate of firearm suicides.
That is only common sense. Just like homes with bathtubs will have more drownings in bathtubs than homes without bathtubs.
That said i like what you are trying to do here. That is if all the data is accurate and unbiased.
I know what you are saying..but honestly, if someone wants to kill themselves, they are going to find the most convenient way to do so. If they don't own a gun, they can choose from any number of methods to 'off' themselves.
All that I can say is that I did not assemble the data with a preconceived conclusion though I did try to find items that might have some sort of predictive power.
I had no control over the data collection. If it has been accurately recorded, even data from biased sources can be of value.
Just ballparking it - I don't see a relationship between household ownership and Homicide or Gun Homicide. But I can make a good case for Firearm related Suicide.
Hawaii was a big surprise - note the change in household firearm ownership. Turns out it is not a typo.
There is no causation to be found on any of these anti gun bias "studies".
Suicide is a mental health issue and not a gun issue. Until seeing a mental health pro in this country is as common as seeing a doctor for a cold the suicide rate will continue to rise and fall.
I don't offhand disagree with you, but when I saw the relationship to guns and suicide I did a bit of research.
It is truly depressing to research suicide.
Here's the deal - firearm attempted suicide is 85% effective.
Other means often give a window of time to call 911 or be found. For those who fail an attempt at suicide - they have a 90% chance of not attempting it again (assuming some intervention).
Many times, at least, suicide is an impulsive decision. Any delay that can be built in reduces the risk.
See above comment .
And there is no causation! The presence of a gun doesn't mean somebody will off themselves.
Suicide is a human right. Nobody has the right to force a person to stay. This isn't "Hotel California" and we can check out anytime we like and we can leave.
No of course there is no causation - however the gun is 85% lethal.
Consider this - say I travel around and find people who have just lost a loved one, or lost their job, or who are being unmercifully harassed by co-workers or classmates.
And I give them a loaded gun as a gift. (This assumes a state where the laws permit such a gift.)
Am I responsible if they commit suicide with it?
If it were a member of your family - would you accept my statement of
... or would you hold me responsible?
I would and I have.
If you want to make a difference in the suicide rate then work on improvements to our lacking mental health system.
I would hold such a person accountable so I will not press the point with you.
And what would you do to punish that person?
Most, (not all), police shot and killed while on duty are in Southern red states, where gun laws are lax.
That statement is disingenuous at best. By your own data three of the top five states/territories with the largest numbers of deaths are not Southern Red states
Texas, Florida, New York, California and Puerto Rico in that order
Texas and Florida outpace the other three by a huge margin too.
they do but it's pretty much population based. They have the greater populations. A more fair analysis would be to consider LEO homicides per capita.
I suspect the numbers would even out a lot more then.
You can copy and paste the date into a spreadsheet - paste unformatted with a : as the separator.
Then copy and paste state populations from somewhere. You will probably want to use an =lookup() function with a false statement to like up the data.
Divide the number of fallen officers by the state population - then if you want multiply by 1,000,000 for a rate per million.
You will then need to check each state to see what the ration of gunfire deaths are to "other".
Calculate the percentage for each state and multiply by the above.
I think you will find that law enforcemnt in California has less of a chance of dying by gunfire and law enforcement in Texas, New York and Florida. I hate to compare it to Delaware since the population so much smaller.
Might be something in this newspaper database on the matter.
This is what happens when you have a governor like Rick Scott that LOVES to do away with gun laws.
2015. Anyone else notice that the states with the highest rate of homicide by firearm are all red states? Weird! (said no one ever)
I guess you didn't notice that those states are states with a high percentage of minorities. The white homicide rate is about 2/100k nationally and the black rate is 15/100k
Homicide is higher in major cities as well. In my state of MO in 2016 there were 529 homicides. 389 were in two cities KC and StL.
Statewide 336 of the homicides were black while 193 were white. 63% of our state's homicides were black.
The problem that BLM and the left doesn't want to talk about.
Homicide tends to stay in racial groups. When it does cross racial lines nationally blacks kill twice as many whites as whites kill blacks (FBI ucr)
If you wanted to work on that - here's a link with the state racial data for 2016
Blaming white cops gets more traction than self inflicted genocide so it would be a waste of time.
Absolutely not.
That doesn't mean you stop looking.
Kinda like TANSTAAFL doesn't mean we can't have lunch.
Interesting. The District of Columbia has an "A" for gun laws yet has almost the highest homicide rate.
Better - Hawaii gets an A too and has about the lowest. This points out an area to research.
The group giving the A is an anti gun group and their ratings are meaningless. It doesn't matter what your state's homicide rate is as long as your state has tough gun laws.
That would be worth knowing if any are enforcing their laws.